Figures & data
Figure 1. Study design. Stable implants. A weight-loaded HA-coated (PO-HA) and a non-HA-coated porous implant (PO) were randomly allocated to medial or lateral condyle of both knees. High-density polyethylene particles were injected into the right knee joint. The left knee served as control, and received only hyaluronic acid. Unstable implants. In dogs with micromotion devices, implants were inserted into each medial femoral condyle. A PO-HA implant was randomly allocated to either left or right knee, and a PO implant was then inserted into the opposite knee. PE particles were injected into both the left and the right knee.
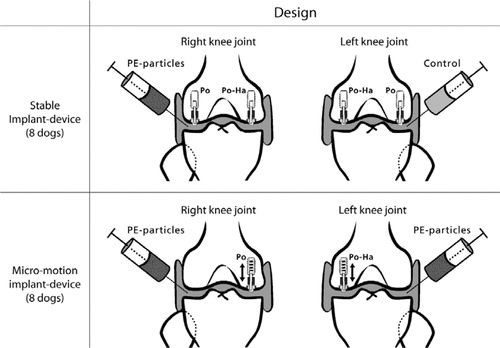
Figure 2. Implant devices. a. Implant device and test implant positioned in the weightbearing part of the femoral condyle (modified from Søballe et al. (Citation1992b, Citation1993)). 1. Threaded anchorage screw fixed in bone. 2. In the micro-motion device, a spring allows the piston to move 500 μm vertically. At each gait cycle, the PE plug and the implant were displaced 500 μm by tibia. When the pressure on the plug was released, the implant and plug were repositioned by means of a spring in the anchorage screw. 3. Threaded piston, which is centralized in the drilled hole by the anchorage screw. 4. Test implant mounted on the piston. 5. Gap measuring 0.75 mm, between implant surface and trabecular bone. 6. Titanium ring inserted into the subchondral part of the condyle to prevent early tissue ongrowth to the polyethylene plug. 7. Protrusion of the polyethylene plug (diameter 4.5 mm), which transmits the load from the tibial part of the knee to the implant system. b. Stable implant devices. Appearance of the femoral condyle after implantation of the stable implant device. Note the gap between the PE plug and the titanium ring, which allows the joint fluid access to the bone-implant interface. c. Unstable implant devices. The PE plug used for the micromotion devices had four tabs measuring 1 mm2. The extensions were added to ensure only vertical movement in the system. There was a gap of 250 μm between the ring and the PE plug tabs. It was possible for joint fluid to gain access to the bone-implant interface between the tabs.
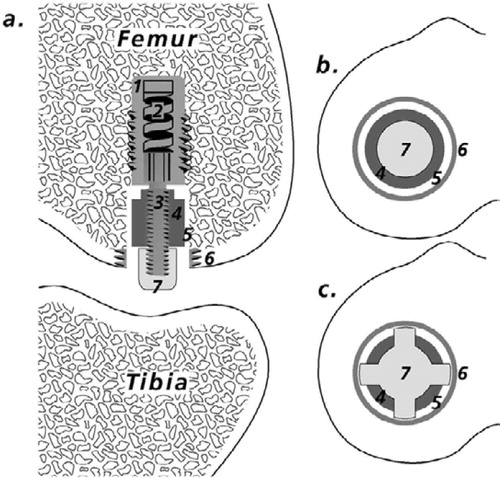
Figure 3. Preparation of bone-implant specimens. The cylindrical implant was cut vertically through the middle. By random choice, one-half remained undecalcified and was embedded in MMA. The other half was cut vertically through the middle of the implant. A posterior and anterior block were thus produced, each containing one-quarter of the implant. By random choice, one part was stored in formaldehyde and decalcified (EDTA). The implant was gently removed from the surrounding tissue, which was then embedded in paraffin. The remaining part was stored in 70% alcohol for a possible later analysis, which was not included in this work.
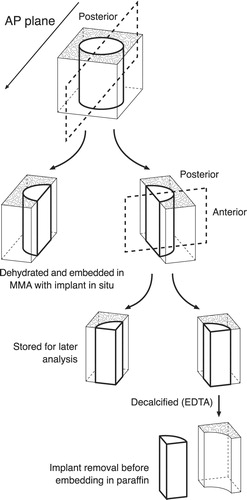
Figure 4. This simplified diagram shows a histological section with an implant. The counting frame is moved stepwise from the juxta-articular tip of the implant to the base of the implant, thus dividing the peri-implant area into eight zones. The initial peri-implant gap around the implant is indicated.
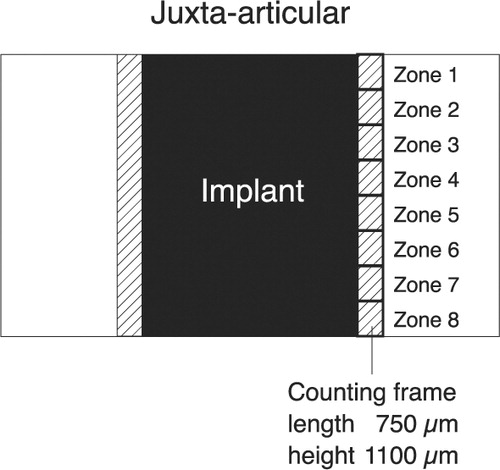
Figure 5. Fibrous membrane from an unstable PO implant. Hematoxylineosin stained section viewed with polarized light; 200 × The void down to the left represents the original placement of the porous implant. Birefringent PE particles can be seen scattered in a fibrous membrane dominated by fibroblasts. Only a few macrophages can be seen in the membrane.
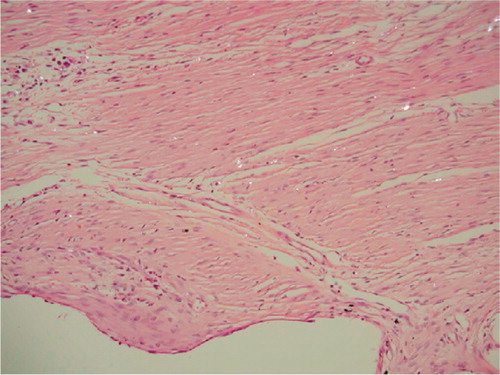
Figure 6. Stable implants. Distribution of PE particles in peri-implant zones (compare with ). Median values. Error bars represent interquartile range. Zone 1 is the zone closest to the joint space. P-values are given in the figure.
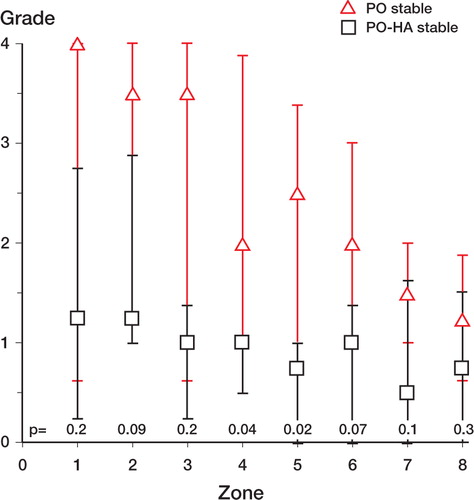
Figure 7. Unstable PO implant. MMA section with the implant stained in situ with basic fuchsin and light green. Polarized light microscopy, 200 × Microscopic field of the fibrous membrane at zone 4. Multiple PE particles are scattered in the tissue. Note the absence of fibro-cartilage and bone.
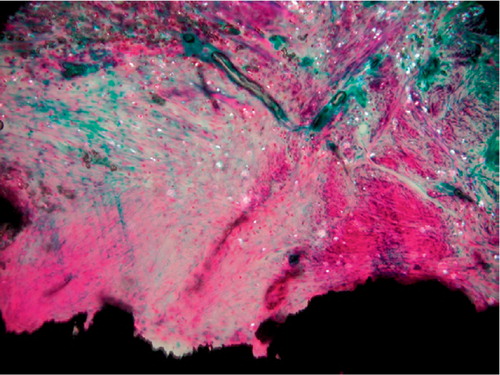
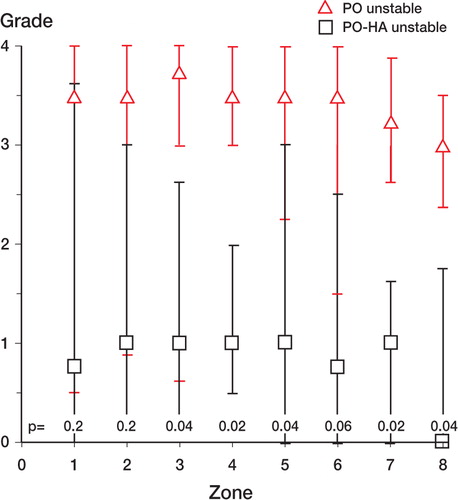
Figure 8. Unstable implants. Distribution of PE particles in peri-implant zones (compare with ). Median values. Error bars represent interquartile range. Zone 1 is the zone closest to the joint space. P-values are given in the Figure.
Tissue ongrowth and gap healing for stable implants and unstable implants. The median value (range) of bone and fibrous tissue in the 6 experimental groups (n = 8)