Figures & data
Figure 1. The diagram of the paradigm. P and T stood for the probe and tetanus block, respectively. (a) The Tetanus condition and (b) the control condition.
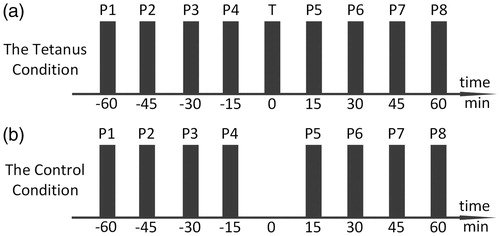
Figure 2. The diagram of the T-block and P-block.
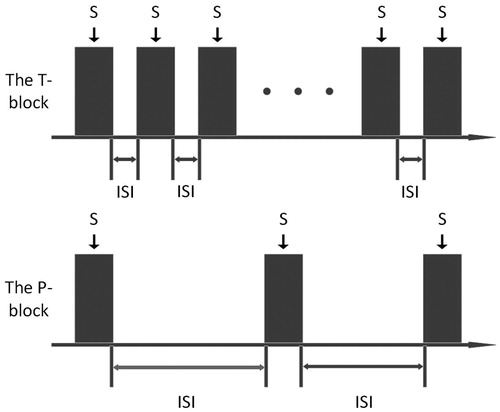
Figure 3. Butterfly plots and mean global field power (MGFP).
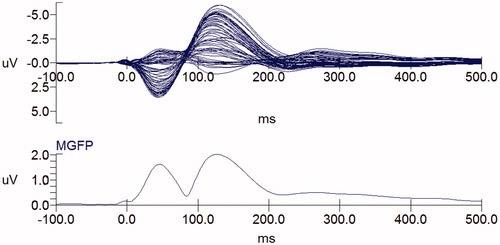
Table 1. The peak time and time window of N1 wave.
Figure 4. The 2D map of the scalp current density of N1.
Figure 5. Source localization of N1. Grand averaged data showed the N1 source distributions of pre- (a) and post-tetanus (b) conditions.
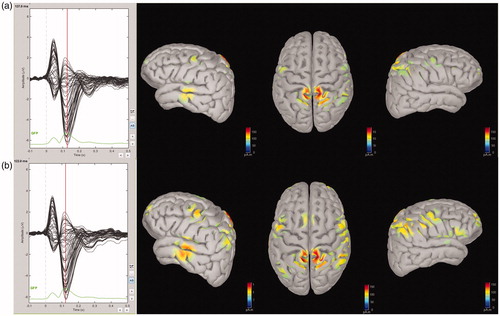
Figure 6. Auditory tetanic stimulation induced potentiation on the N1. In the Tetanus condition (left column), the post-tetanus amplitude of the N1 was higher than that of pre-tetanus, whereas there was no such increase in the Control condition (right column). (a) 1 kHz PT, (b) 1 kHz NBN, (c) 6 kHz PT, (d) 6 kHz NBN, and (e) WN. The black lines are pre-tetanus waves, and the red lines are post-tetanus waves.
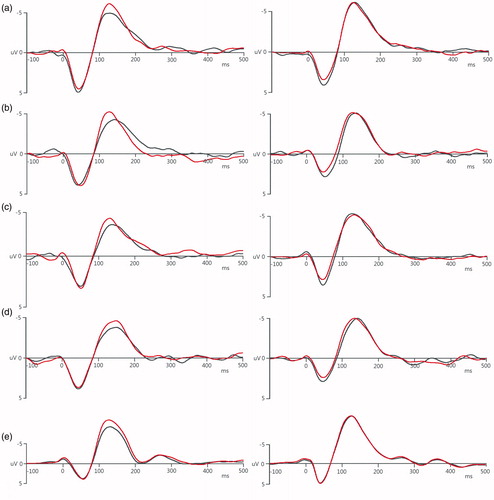
Table 2. Bonferroni’s corrected p values for the ANOVA results.
Table 3. Analysis of stimulus and condition.
Table 4. The percentage of the N1 amplitude of post-tetanus blocks over the baseline.
Figure 7. The standard deviation of the percentage of the post-tetanus N1 amplitude over baseline was illustrated for the five stimuli in the Tetanus condition and the Control condition, with the Tetanus condition plotted as a dark bar and the Control condition as a light bar.
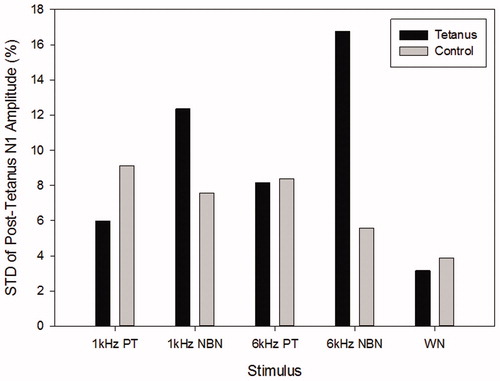
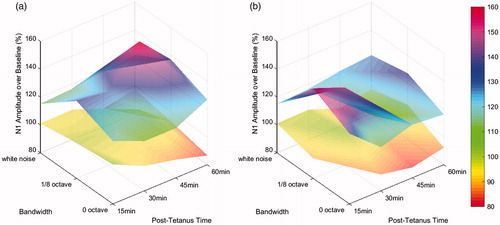
Figure 8. (a) The percentage of the post-tetanus N1 amplitude over time and bandwidth for a center frequency of 1 kHz and (b) the percentage of the post-tetanus N1 amplitude over time and bandwidth for a center frequency of 6 kHz, where x-axis was the post-tetanus time in minutes, y-axis was the bandwidth of the stimulus ranging from 0 octave, 1/8 octave to full band, and z-axis was the percentage of the post-tetanus N1 amplitude over the baseline.