Figures & data
Table 1. Sample characteristics of RRP patients, biopsy site: 1: false vocal folds, 2: vocal folds.
Figure 1. Flowchart for histochemistry and GEMMA (gas-phase electrophoretic molecular mobility analyzer analysis), FVF: false vocal folds, VF: vocal folds.
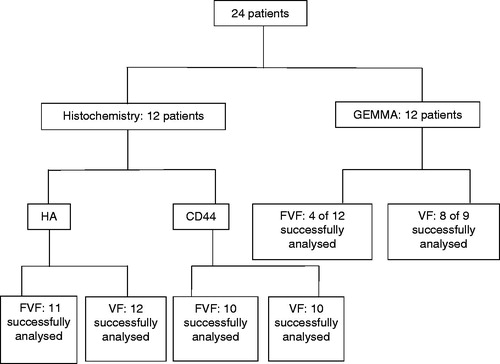
Figure 2. Mass distribution analysis of hyaluronan (HA) using GEMMA (gas-phase electrophoretic molecular mobility analyzer). LMHA: Low mass Hyaluronan. HMHA: high mass hyaluronan. Two major peaks of HA were detected ranging from about 50 kDa to larger than HA standards (>10 MDa). There was a trend of relatively more of the very high mass HA (vHMHA) in the vocal folds compared to false vocal folds. HA from skin biopsy analyses at our laboratory did not show vHMHA.
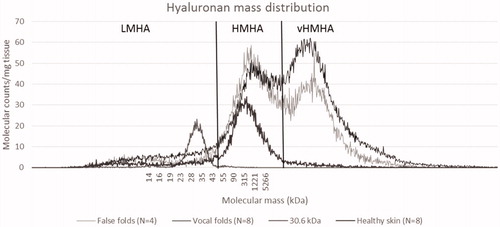
Table 2. Scoring of HA and CD44 throughout the epithelium, stroma and RRP lesion in vocal folds and false vocal folds.
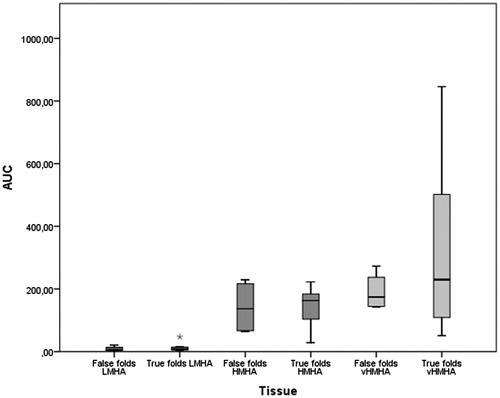
Figure 3. Area under curve (AUC) from GEMMA (gas-phase electrophoretic molecular mobility analyzer) mass distribution analysis. AUC equals relative amount of hyaluronan in tissue. Low mass hyaluronan (LMHA) and high mass hyaluronan (HMHA) showed little variation between true and false vocal folds. High variation was observed of very high mass hyaluronan (vHMHA) in true vocal folds compared to false vocal folds. Levene’s test for equality of variances, vHMHA p = .046