Figures & data
Table 1. Patient and tumor characteristics.
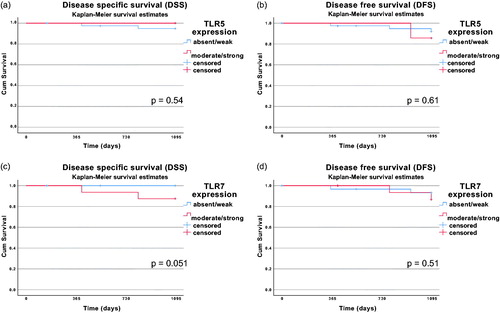
Figure 1. Kaplan–Meier curves with 3-year disease-specific survival (DSS) and 3-year disease-free survival (DFS) for patients with HPV+ BOTSCC stratified for absent/weak vs. medium/strong TLR5 expression (A and B) and absent/weak vs. medium/strong TLR7 expression (C and D). Differences in survival was analyzed with the log-rank test. No differences in survival were observed (TLR5 DSS: p = .54; TLR5 DFS: p = .61; TLR7 DSS: p = .051; TLR7 DFS: p = .51).