
Figures & data
Table 1. Patient characteristics and treatment modalities.
Figure 1. Cells were grown in flask until approximately 50% confluent and photographed using a phase contrast microscope. (A) LU-TC-1, (B) LU-TC-2, (C) LU-TC-7, (D) LU-TC-8, (E) LU-TC-10, (F) LU-TC-12, (G) LU-TC-14, and (H) LU-TC-15. Bars indicate 100 µm.
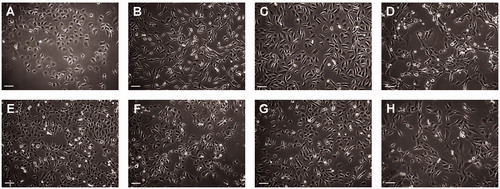
Table 2. STR analysis.
Table 3. Cytological and cytochemical characteristics.
Figure 2. Xenograft tumors were sectioned and stained with hematoxylin and eosin. (A) LU-TC-1, (B) LU-TC-2, (C) N/A due to no xenograft tumor take of LU-TC-7, (D) LU-TC-8, (E) LU-TC-10, (F) LU-TC-12, (G) LU-TC-14, and (H) LU-TC-15. Bars indicate 100 µm.
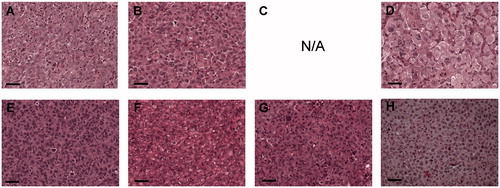
Table 4. Composite karyotypes.
Table 5. Mutation status of TP53, BRAF and RET and sensitivity to doxorubicin, paclitaxel, radiation, and vemurafenib.
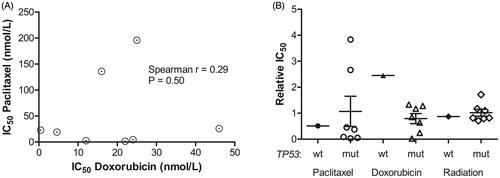
Figure 3. Comparison between doxorubicin and paclitaxel response, treatment response and TP53 mutational status. (A) The IC50 for doxorubicin was plotted against the IC50 for paclitaxel and the nonparametric Spearman correlation calculated using GraphPad Prism software. (B) For each treatment, the cell lines were grouped according to TP53 status, and the p-values calculated using the nonparametric Mann–Whitney test in the GraphPad Prism software.