Figures & data
Table 1. Subject demographics.
Figure 1. The average ADHEAR-aided thresholds and the pure tone average for air conduction and bone conduction thresholds at 3 months after use. (A) In conductive hearing loss patients (n = 6) and (B) SSD patients (n = 3). With the use of the adhesive hearing device, ADHEAR, the aided thresholds were improved on average by 36.5 dBHL and 45.0 dBHL for the conductive hearing loss subgroup and the SSD subgroup, respectively. Bone conduction thresholds in the SSD group indicate hearing levels in the contralateral, healthy ear (B). SSD: sensorineural single-sided deafness.
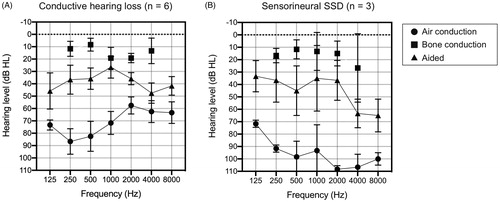
Figure 2. Speech perception tests in multiple noise configurations at 3 months after use. (A–C) In conductive hearing loss patients and (D) SSD patients. For the S0Nnormal ear conditions in the conductive hearing loss subgroup, the speech perception scores for the unaided and aided conditions were improved from 52% to 59% at SN0 and from 19% to 43% at SN-5 (∗p < .05) (A). There were no significant differences in the speech perception scores between the unaided and aided conditions for the S0N0 and S0Naided configurations (B, C). For the sensorineural SSD subgroup, no significant differences were observed for the S0Nnormal ear conditions (D). SSD, sensorineural single-sided deafness.
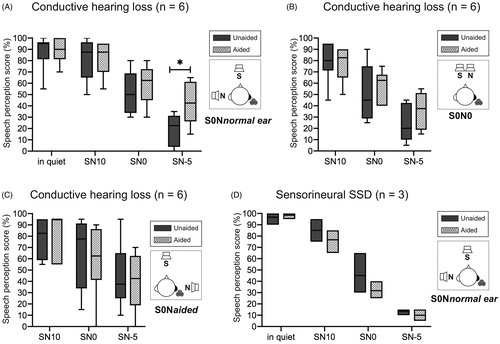
Figure 4. The SSQ questionnaire under unaided and aided conditions obtained at 3 months after use.
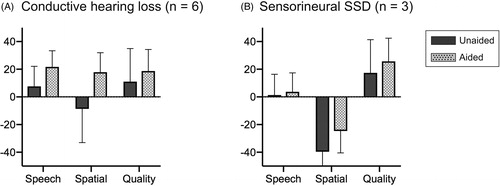
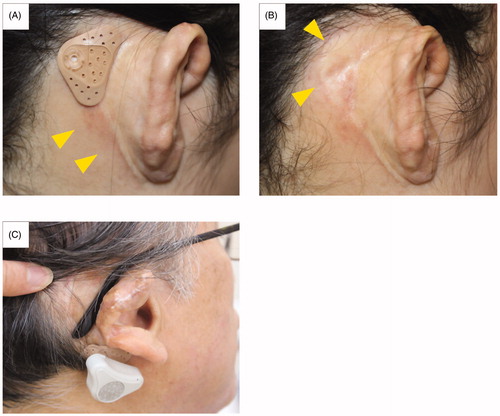
Figure 5. Mild dermatitis around the adhesive adapter and inappropriate position of the device. Mild dermatitis around the adhesive adapter was observed in subject ACU1. The erythema is observed only in the surrounding area and not directly under the area of contact with the adapter (A, B). Subject ACB2 placed the adapter on the lower mastoid area so he could not obtain sufficient gain from the device due to sound transmission attenuation by the soft tissues.