
Figures & data
Figure 1. The eight main groups of the NTSRS population, characteristics and trends 2009–2018. Presented with APCs and 99% CI. * APC significantly different from zero at the 0.01 level. † Trend shift/Join point in 2014.
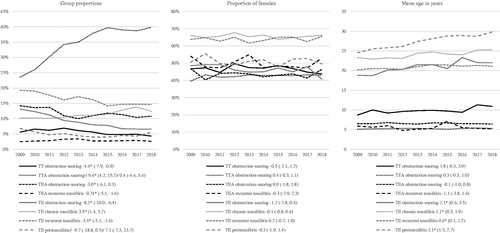
Figure 2. Rates of surgical techniques for TE and TT (in TE/TEA and TT/TTA procedures) 2009-2018. Presented with APCs and 99% CI. ‘Undefinable techniques’ is not presented in figure. *APC significantly different from zero at the 0.01 level. † Trend shift/Join point in in 2013.
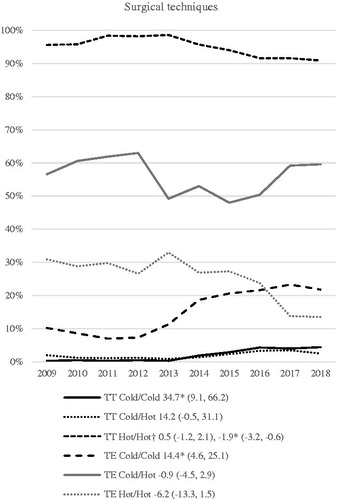
Table 1. Relative risks (RR) for postoperative bleedings related to surgical technique for dissection and haemostasis of the tonsils.
Figure 3. Rates of bleeding complications 2009-2018. Presented with APCs and 99% CI. * APC significantly different from zero at the 0.01 level. † Trend shift/Join point in 2012. ‡ TT snoring APC could not be calculated as no bleedings occurred in 2011.
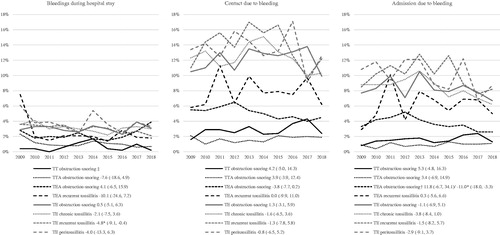
Figure 4. Rates of contact due to pain 2009–2018. Presented with APCs and 99% CI.
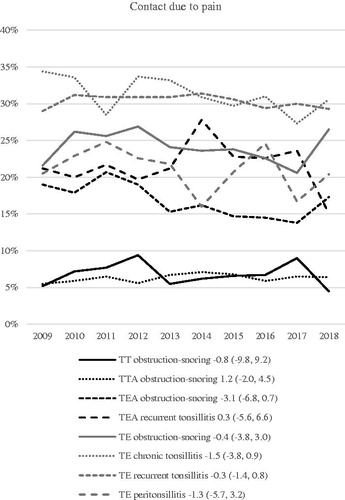
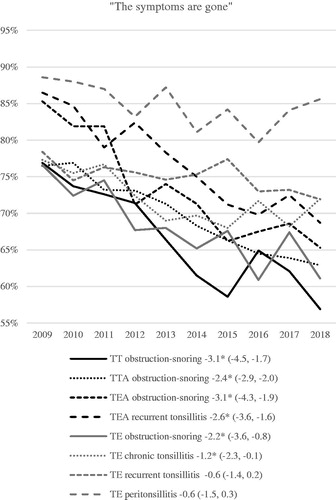
Figure 5. Rates of patients reporting ‘The symptoms are gone’ 6 months after surgery 2009–2018. Presented with APCs and 99% CI. * APC significantly different from zero at the 0.01 level.
Data sharing
Data from the NTSRS is regulated by Swedish law. Research using NTSRS data may be carried out following approval by an ethics committee. Please contact the Centre of Registers Västra Götaland for more information ([email protected]).