Figures & data
Figure 1. Measurement of stapes footplate thickness. (A) Normal control. Line in A represents a perpendicular line across the stapes footplate at the midpoint between the anterior and posterior crura. (B) Profile curve in A. Longitudinal axis shows HU value along the perpendicular line shown in A. Width was measured as representing stapes footplate thickness using the full width at half maximum (FWHM) method. (C) Otosclerosis patient. Line in C represents a perpendicular line across the stapes footplate at the midpoint between the anterior and posterior crura. (D) Profile curve in C. Longitudinal axis shows HU value along the perpendicular line shown in C. Width was measured using the FWHM method, resulting in much thicker width than in the normal control (B).
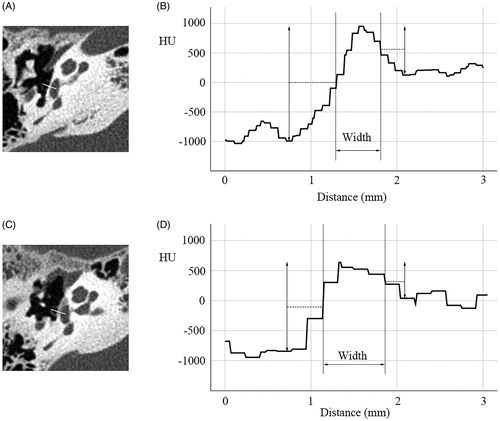
Figure 2. Images from ultra-high-resolution CT (A) and conventional high-resolution CT (B) of the same patient. A. U-HRCT image (0.25-mm slice thickness) in the lateral semicircular canal plane. Decreased HU value in the fissula ante fenestram and stapes was noted. B. HRCT image (1-mm thickness) in the lateral semicircular canal plane. This image was obtained 3 months before A at another hospital. Lesions at the stapes and fissula ante fenestram are not clear on this image.
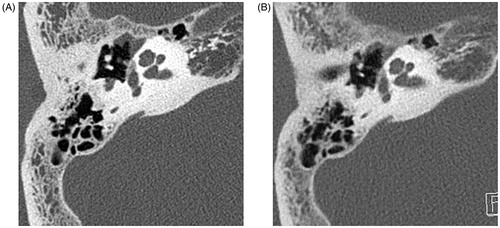
Table 1. Footplate thickness at three points in controls and otosclerosis patients.
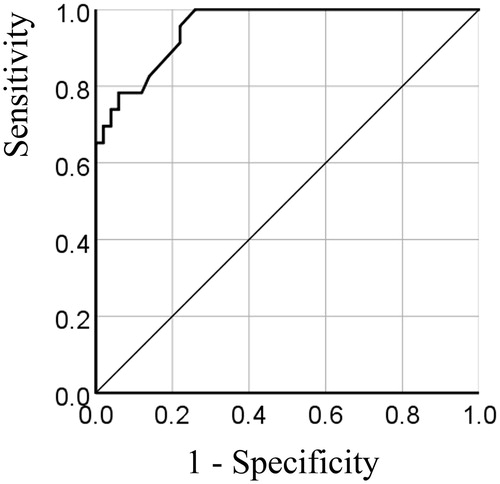
Figure 3. Receiver operating characteristic analysis for stapes footplate thickness in control and otosclerosis patients. Area under the curve, 0.953 (95% confidence interval, 0.911–0.996).