Figures & data
Figure 1. Illustrations of the various effects of binaural hearing (image courtesy of MED-EL).
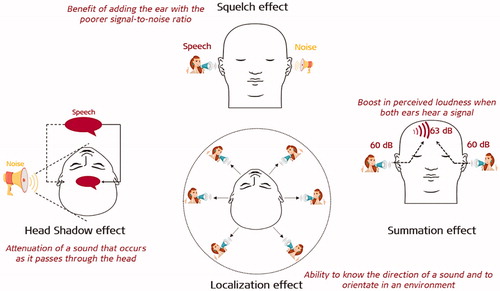
Figure 2. ENT surgeons from Julius-Maximilian University of Würzburg, Germany, who performed the first bilateral CI implantation with MED-EL’s CI device (in 1996).

Figure 3. Engineers and audiologists who designed and developed the HSM sentence test to evaluate the speech understanding of CI users in noise. 1MED-EL and 2University of Würzburg, Germany.

Figure 4. (A) Monosyllabic word scores at 80 dB sound pressure level (SPL) of the very first patient. (B) Test scores in noise (numbers, HSM sentences, monosyllabic words, S/N ratio 5-13 dB) for 4 bilaterally implanted adult patietns (n = 17 tests).
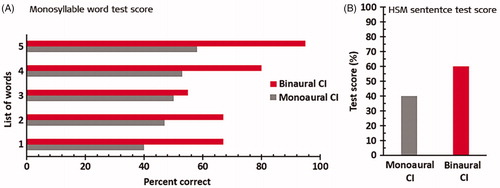
Figure 5. Symmetrical test setup to quantify the gain in SNR at the SRT (A). The average gain in the SNR overtime at the speech reception threshold (ΔSNR50) of eight patients under bilateral CI condition (B). Test scheme and histogram created from data given in Schön et al. [Citation9].
![Figure 5. Symmetrical test setup to quantify the gain in SNR at the SRT (A). The average gain in the SNR overtime at the speech reception threshold (ΔSNR50) of eight patients under bilateral CI condition (B). Test scheme and histogram created from data given in Schön et al. [Citation9].](/cms/asset/a63d4932-4416-46db-ada4-cfe5135a2f8f/ioto_a_1888193_f0005_c.jpg)
Figure 6. The first row showing audiological test results with mean, median and standard deviation at first and third quartile (A). The second row showing binaural advantage due to head shadow, squelch and the bilateral summation effects, calculated from the first-row results [Citation3] (B). Statistical analysis: Two-tailed tests were used for all comparisons. Reproduced by permission of Wolters Kluwer Health, Inc.
![Figure 6. The first row showing audiological test results with mean, median and standard deviation at first and third quartile (A). The second row showing binaural advantage due to head shadow, squelch and the bilateral summation effects, calculated from the first-row results [Citation3] (B). Statistical analysis: Two-tailed tests were used for all comparisons. Reproduced by permission of Wolters Kluwer Health, Inc.](/cms/asset/ee096871-ec53-4cc3-90ef-69a16d876130/ioto_a_1888193_f0006_c.jpg)
Figure 7. A collaboration between CI surgeons and audiologists from Germany (1Ruhr University Bochum, 2University of Würzburg) and Switzerland (3University of Bern) who evaluated the effectiveness of bilateral CI in postlingually deaf patients.
Figure 8. Scores of HSM sentence test at 70 dB hearing level and 10 dB signal-to-noise ratio (S/N). Histogram created from the data given in Stark et al. [Citation10].
![Figure 8. Scores of HSM sentence test at 70 dB hearing level and 10 dB signal-to-noise ratio (S/N). Histogram created from the data given in Stark et al. [Citation10].](/cms/asset/d58d487e-8d40-4239-869e-4a5931d6baec/ioto_a_1888193_f0008_c.jpg)
Figure 9. Dr phil. Heike Kühn-Inacker, Psychologist, Universitätsklinikum, Würzburg, Germany.

Figure 10. Audiologist and CI surgeons from the University of Hong Kong Medical Centre, Queen Mary Hospital, Hong Kong.

Figure 11. Mean percentage of correct Cantonese lexical tone discrimination scores, obtained from four bilaterally and eight unilaterally implanted CI patients at various SNRs and in quiet. * A score of ≥66.77% was regarded as being significantly above the chance level [Citation12]. Reproduced by permission of Elsevier B.V.
![Figure 11. Mean percentage of correct Cantonese lexical tone discrimination scores, obtained from four bilaterally and eight unilaterally implanted CI patients at various SNRs and in quiet. * A score of ≥66.77% was regarded as being significantly above the chance level [Citation12]. Reproduced by permission of Elsevier B.V.](/cms/asset/958ea47b-a322-43f2-bd67-bc75237dcb2b/ioto_a_1888193_f0011_c.jpg)
Figure 12. MED-EL specialists who were involved in evaluating the sound localisation abilities of bilateral MED-EL CI users in the year 2004.
Figure 13. Sound localisation responses in 3 different patterns. The left column shows results for left CI only; middle column for both CIs; right column for the right CI only [Citation14]. Statistical analysis: Post hoc analysis (p ≤ 0.05). Reproduced by permission of Wolters Kluwer Health, Inc.
![Figure 13. Sound localisation responses in 3 different patterns. The left column shows results for left CI only; middle column for both CIs; right column for the right CI only [Citation14]. Statistical analysis: Post hoc analysis (p ≤ 0.05). Reproduced by permission of Wolters Kluwer Health, Inc.](/cms/asset/a8c308ac-8da7-4c17-a1d9-e8ffc99a67f0/ioto_a_1888193_f0013_c.jpg)
Figure 14. Mean of monosyllabic word discrimination scores tested in quiet with both CIs, as well as with the right CI and left CI separately. Statistical analysis: Wilcoxon test and paired t-test. Histogram created from data given in Kühn-Inacker et al. [].
![Figure 14. Mean of monosyllabic word discrimination scores tested in quiet with both CIs, as well as with the right CI and left CI separately. Statistical analysis: Wilcoxon test and paired t-test. Histogram created from data given in Kühn-Inacker et al. [].](/cms/asset/256a3611-69cc-4aec-98df-48f3e6d822f3/ioto_a_1888193_f0014_c.jpg)
Figure 15. (A) Localisation bias фB as a function of loudness difference between right and left CI. (B) Mean values and standard deviation error values of lateralisation L as a function of interaural time difference τ for subject A from the previous experiment shown in graph A [Citation15]. Reproduced by permission of Wolters Kluwer Health, Inc.
![Figure 15. (A) Localisation bias фB as a function of loudness difference between right and left CI. (B) Mean values and standard deviation error values of lateralisation L as a function of interaural time difference τ for subject A from the previous experiment shown in graph A [Citation15]. Reproduced by permission of Wolters Kluwer Health, Inc.](/cms/asset/1f1fd3e2-8da0-4df3-baa4-7034fa065b1e/ioto_a_1888193_f0015_b.jpg)
Figure 16. Group average MAA values for two groups of paediatric patients, both in bilateral and monaural CI listening condition. CI–CI = bilateral CI; CI–HA = CI on one ear and a hearing aid on the contralateral ear. Statistical analysis: Paired-sample t-tests (p < .05). Histogram created from data given in Litovsky et al. [Citation16].
![Figure 16. Group average MAA values for two groups of paediatric patients, both in bilateral and monaural CI listening condition. CI–CI = bilateral CI; CI–HA = CI on one ear and a hearing aid on the contralateral ear. Statistical analysis: Paired-sample t-tests (p < .05). Histogram created from data given in Litovsky et al. [Citation16].](/cms/asset/f8501d39-7e11-4f88-ba75-5c0ef7f717fa/ioto_a_1888193_f0016_c.jpg)
Figure 17. Audiological test setup (A). HINT test hearing threshold showing lower values for the bilateral CI listening condition (B). Speech recognition in noise evaluated using the CST showed higher values for bilateral CI listening condition even at long-term test period of seventeen months (C and D) [Citation18]. Statistical analysis: ANOVA test (p < .05). Reproduced by permission of Wolters Kluwer Health, Inc.
![Figure 17. Audiological test setup (A). HINT test hearing threshold showing lower values for the bilateral CI listening condition (B). Speech recognition in noise evaluated using the CST showed higher values for bilateral CI listening condition even at long-term test period of seventeen months (C and D) [Citation18]. Statistical analysis: ANOVA test (p < .05). Reproduced by permission of Wolters Kluwer Health, Inc.](/cms/asset/92af7269-d7a7-4705-9f0c-a2496edb97db/ioto_a_1888193_f0017_c.jpg)
Figure 18. Patient wearing MED-EL CI device on both ears. Speech recognition test results showing better hearing in bilateral listening condition [Citation19].
![Figure 18. Patient wearing MED-EL CI device on both ears. Speech recognition test results showing better hearing in bilateral listening condition [Citation19].](/cms/asset/1bf2fcda-1251-417c-bdbc-7cd0f9b76032/ioto_a_1888193_f0018_c.jpg)
Figure 19. Clinicians from different centres in the USA evaluated the long-term effectiveness of bilateral CI in adults: 1The University of North Carolina School of Medicine, 2Vanderbilt University School of Medicine, 3University of Texas Southwestern, 4Dallas Otolaryngology Associates, 5Medical College of Wisconsin, and 6Research Triangle Institute.

Figure 20. The distribution of CNC word scores in quiet (in %) is plotted as a function of the post-surgery test intervals. Horizontal lines indicate the median of each distribution, boxes span the 25th to 75th percentiles, vertical lines show the 10th to 90th percentile range, and stars indicate the minimum and maximum scores. Data for the worse of the two unilateral conditions are indicated with dark grey shading, those for the better unilateral condition with solid white shading, and those for the bilateral condition with grey and white hatching [Citation21]—statistical analysis: ANOVA test (one-tailed, p < .05). Reproduced by permission of Wolters Kluwer Health, Inc.
![Figure 20. The distribution of CNC word scores in quiet (in %) is plotted as a function of the post-surgery test intervals. Horizontal lines indicate the median of each distribution, boxes span the 25th to 75th percentiles, vertical lines show the 10th to 90th percentile range, and stars indicate the minimum and maximum scores. Data for the worse of the two unilateral conditions are indicated with dark grey shading, those for the better unilateral condition with solid white shading, and those for the bilateral condition with grey and white hatching [Citation21]—statistical analysis: ANOVA test (one-tailed, p < .05). Reproduced by permission of Wolters Kluwer Health, Inc.](/cms/asset/775bfbf9-893d-483a-8247-f002bdf072f4/ioto_a_1888193_f0020_b.jpg)
Figure 21. Speech recognition scores in percentage correct for the best unilateral (black) and bilateral (grey) ear conditions for individual patients implanted with various CI brands. Subject 1: MED-EL; Subject 2: HiRes 90 K; Subject 3: MED-EL; Subject 4: MED-EL; Subject 5: Nucleus; Subject 6: Nucleus; Subject 7: HiRes 90 K [Citation22]. * indicates statistical significance between unilateral and bilateral CI condition. Reproduced by permission of Wolters Kluwer Health, Inc.
![Figure 21. Speech recognition scores in percentage correct for the best unilateral (black) and bilateral (grey) ear conditions for individual patients implanted with various CI brands. Subject 1: MED-EL; Subject 2: HiRes 90 K; Subject 3: MED-EL; Subject 4: MED-EL; Subject 5: Nucleus; Subject 6: Nucleus; Subject 7: HiRes 90 K [Citation22]. * indicates statistical significance between unilateral and bilateral CI condition. Reproduced by permission of Wolters Kluwer Health, Inc.](/cms/asset/00fe93d5-cd04-400b-af76-f6f454304019/ioto_a_1888193_f0021_b.jpg)
Figure 22. Clinicians from different centres who looked into the music perception of CI users: 1Nottingham Cochlear Implant Programme, UK; 2University of Würzburg (in 2009), Germany; 3University of Bern, Switzerland; 4University of Basel, Switzerland, and Technical University of Munich, Germany.

Figure 23. The x-axis describes the various instruments recognised in musical pieces; the y-axis is the percentage of yes answers for normal hearing, bilateral CI users, and unilateral CI users [Citation31]. Histogram created from data given in Veekmans et al. [Citation31].
![Figure 23. The x-axis describes the various instruments recognised in musical pieces; the y-axis is the percentage of yes answers for normal hearing, bilateral CI users, and unilateral CI users [Citation31]. Histogram created from data given in Veekmans et al. [Citation31].](/cms/asset/994984a3-ab86-470b-9ba8-c87d3483ebc7/ioto_a_1888193_f0023_c.jpg)
Figure 24. Participant’s subjective assessment on hearing quality between MED-EL and other CI brand [Citation34,Citation35]. Reproduced by permission of Taylor and Francis Group.
![Figure 24. Participant’s subjective assessment on hearing quality between MED-EL and other CI brand [Citation34,Citation35]. Reproduced by permission of Taylor and Francis Group.](/cms/asset/bd1e6fd7-2280-46f8-91ce-9a7b6c975b98/ioto_a_1888193_f0024_c.jpg)
Table 1. Number of children implanted bilaterally, either simultaneously or sequentially, with different CI brands.
Figure 25. Sound localisation test setup with a child seated in front of the table and facing the centre of the arc of loudspeakers. Active (black) and inactive (grey) loudspeaker positions are shown in degrees azimuth; negative angles denote locations to the left, and positive angles denote locations to the right of the centre [Citation36]—statistical analysis: Linear multivariable regression model.
![Figure 25. Sound localisation test setup with a child seated in front of the table and facing the centre of the arc of loudspeakers. Active (black) and inactive (grey) loudspeaker positions are shown in degrees azimuth; negative angles denote locations to the left, and positive angles denote locations to the right of the centre [Citation36]—statistical analysis: Linear multivariable regression model.](/cms/asset/edded48a-66b4-443e-bb8d-906ab5008c7d/ioto_a_1888193_f0025_b.jpg)
Figure 26. First bilateral CI treatment in an EAS patient by Prof. Paul Van de Heyning from Antwerp Medical University in Belgium in 2010, and Prof. Shin-Ichi Usami from Shinshu University in Japan in 2011.

Figure 27. Dr Eva Karltorp and her colleagues from Karolinska University Hospital, Stockholm, Sweden and University of Oslo, Norway, investigated the importance of early CI treatment in infants on their spoken language development.

Figure 28. Mean slope and delay calculated from individual regressions on receptive vocabulary, according to Peabody test. Graph created from data given in Karltorp et al. [Citation40].
![Figure 28. Mean slope and delay calculated from individual regressions on receptive vocabulary, according to Peabody test. Graph created from data given in Karltorp et al. [Citation40].](/cms/asset/41db24f4-67cd-4c56-a0a2-0d5fb14d6234/ioto_a_1888193_f0028_b.jpg)
Figure 29. Prof. Gao Zhiqiang and his colleagues from Union Medical College Hospital, who demonstrated the safety of simultaneous bilateral CI in children aged 12–18 months.

Figure 30. Data from BCIG showing the number of CI implantations in children unilaterally, simultaneously bilaterally, and sequentially bilaterally, which took place between 2015 and 2019 [Citation45]. Histogram taken from British Cochlear Implant Group.
![Figure 30. Data from BCIG showing the number of CI implantations in children unilaterally, simultaneously bilaterally, and sequentially bilaterally, which took place between 2015 and 2019 [Citation45]. Histogram taken from British Cochlear Implant Group.](/cms/asset/df57193c-ae49-4aba-a30f-30be2cc6296a/ioto_a_1888193_f0030_c.jpg)
Figure 31. Clinicians from Saudi Arabia, who were all part of the early activation and CI surgery under local anaesthesia studies.

Table 2. Summary of studies that reported on the cost-effectiveness associated with bilateral CI treatment.
Figure 32. Experts from Citation1Antwerp Medical University, Belgium, 2Bradford Teaching Hospitals, UK, 3Arizona State University, USA, and 4NYU Grossman School of Medicine, USA, supported the development of Switch-On-Life web-platform.

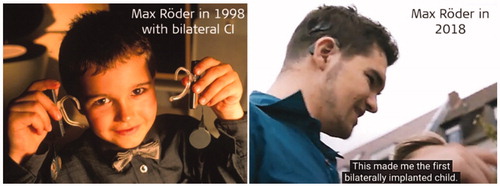
Figure 33. Max Röder, the first bilaterally implanted CI child in the year 1998, who is now a computer science graduate, living his life like every other normal-hearing person (Image courtesy of MED-EL).