
Figures & data
Figure 1. Analysis of click ABR Threshold Changes. (A) Representative diagram of click ABR for the minipigs. The dotted line represents the hearing threshold of 20 dB. (B) The click ABR threshold (dB) before and after surgery. Statistically significant differences were noted between the EAI and the Control at the four postoperative time points of Day 0 (n = 12), Day 7 (n = 12), Day 14 (n = 8), and Day 28 (n = 4). ****p < 0.0001. (C) The click ABR threshold shift (dB) after surgery. No differences were detected by comparing the respective time points in the EAI or the Control (p > 0.05).
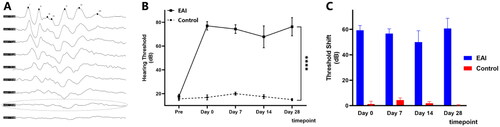
Figure 2. Analysis of tone burst ABR Threshold Changes at full frequencies in the EAI. (A) The tone burst ABR threshold (dB) after surgery at 1 kHz–20 kHz in the EAI. No differences were detected by comparing the respective time points at 1 kHz–20 kHz (p > 0.05). (B) The tone burst ABR threshold shift (dB) after surgery. Solid color for Day 0 postoperatively, 50% transparent color for Day 7, block pattern for Day 14, and translucent color for Day 28. Differences were not found in the comparison of the four time points (p > 0.05).
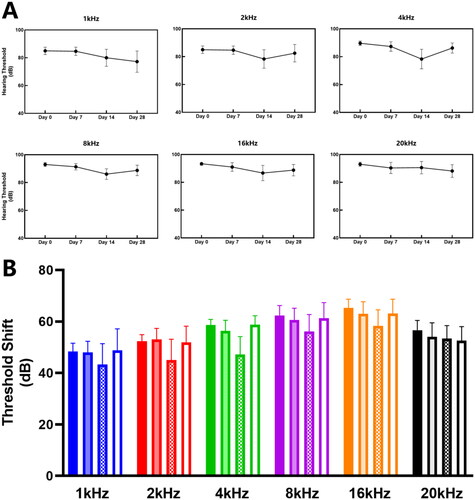
Table 1. The changes of ABR threshold (dB SPL) of different frequencies after surgery.
Figure 3. HE staining of cochlear sections. (A) Typical morphology of the cochlea at 4x magnification. The dashed area is the middle turn of the cochlear. (B) The middle turn of the cochlear at 10× magnification. SV: Scala Vestibuli; SM: Scala Media; ST: Scala Tympani. (C) Spiral ganglion neurons are nested in Rosenthal’s canal at 40× magnification. (D, E, F) Cochlear morphology on postoperative Day 7 (D), Day 14 (E), and Day 28 (F). The arrows mark exudates and newborn fibrous tissue. The placement of the asterisk is the fibrous sheath.
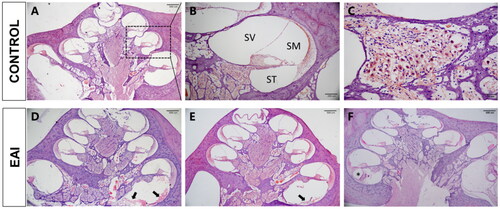
Figure 4. Newborn fibrous tissue within the scala tympani in the EAI. (A) HE stained images of postoperative pathological changes within the scala tympani of the cochlear basal turn (10×). (B) Differences in fibrosis ratio on Day 7, Day 14, and Day 28 postoperatively. The asterisk indicates a significant difference in the fibrosis ratio in comparisons of Day 7 and Day 28 and Day 14 and Day 28 postoperatively; ****p < 0.0001.
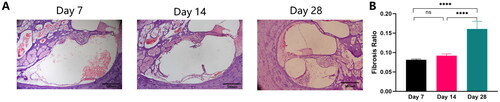
Figure 5. Endolymphatic hydrops in the scala media. (A) HE stained images of postoperative pathological changes within the scala media of the cochlear middle turn (10×, the dotted line represents the normal condition of the Reissner’s membrane). (B) Differences in scala media area ratio of the controls and the EAI on Day 7, Day 14, and Day 28 postoperatively; ***p < 0.001, ****p < 0.0001.
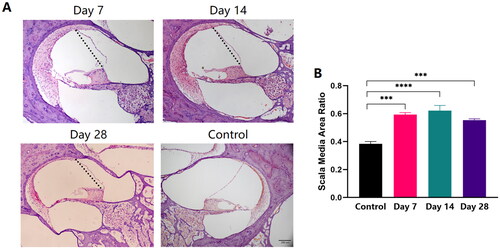
Figure 6. Spiral Ganglion Integrity in Rosenthal’s Canal. (A) HE stained images of SGNs morphology (10×). (B) Postoperatively compared with controls, SGN density in the cochlear’s basal, middle, and apical turn on Day 7, Day 14, and Day 28. No significant changes in SGN density were demonstrated with postoperative time in either the basal, middle, or apical turn (p > 0.05).
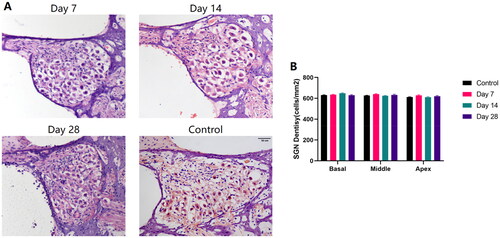
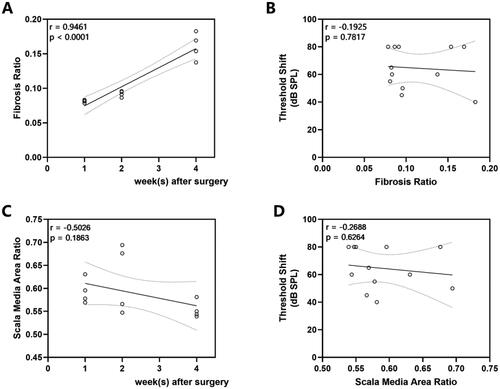
Figure 7. Correlations Between ABR Threshold shifts and Histological Measures. (A) Fibrosis ratio over time (r = 0.9461, p < 0.0001). (B) The relationship between fibrosis ratio and click ABR threshold shifts (r = −0.1925, p = 0.7871). (C) Scala media area ratio over time (r = −0.5026, p = 0.1863). (D) The relationship between scala media area ratio and click ABR threshold shifts (r = −0.2688, p = 0.6264). The line indicates the linear correlation coefficient.
Data availability statement
Data generated or analyzed during this study are available from the corresponding author on request.