Figures & data
Figure 1. Localization and expression of AP-2 and myosin Ⅵ in adult mouse cochlea. Panels A-C show AP-2 labeling (red) and DAPI staining (blue). AP-2 (B) was highly expressed in IHCs but not in OHCs and intensely expressed in the synaptic regions of IHCs (C). D-F shows the dual labeling of myosin Ⅵ (green) and DAPI staining (blue). myosin Ⅵ (E) was highly expressed in both IHCs and OHCs, mainly in the cytoplasmic regions of the cells. Scale bar = 20 µm.
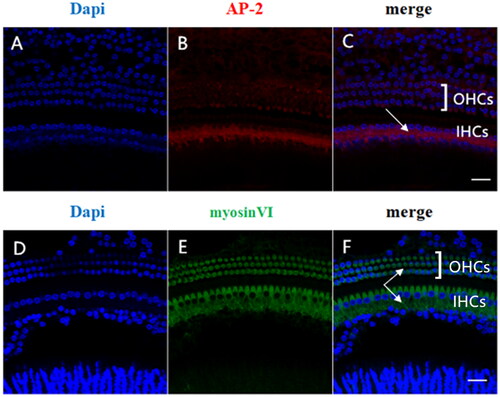
Figure 2. ABR thresholds in mice of different ages. ABR thresholds were recorded in P7, P15, P35 and 16-month-old (aging) mice (n = 10 in each group). The 16-month-old group showed a significant increase in ABR threshold compared with the P15 and P35 groups. The wave pattern observed at P7 was not stable and was not included in the analysis.
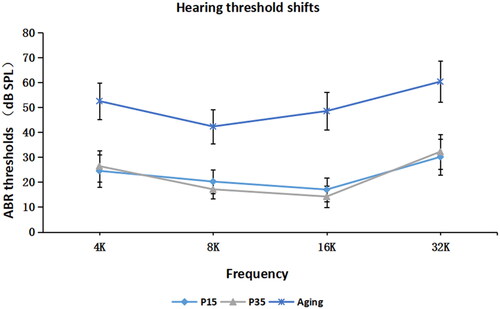
Figure 3. Expression of AP-2 protein in the cochleae of mice of different ages. The tissue was immunohistochemically stained for AP-2 (red) and examined by confocal microscopy. Nuclei were labeled with DAPI (blue). Postnatal day 7 (P7), A–A"; P15, B–B"; P35, C–C"; 16-month-old (aging), D–D". Panels A"–D" show the merged images. Scale bar = 5 µm.
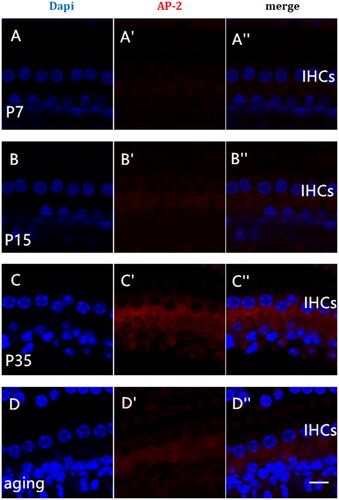
Figure 4. Variations in myosin Ⅵ protein expression in the cochleae of mice of different ages. The tissue was immunohistochemically stained for myosin Ⅵ (green) and examined by confocal microscopy. Nuclei were visualized with DAPI (blue). Postnatal day 7 (P7), E–E"; P15, F–F"; P35, G–G"; 16-month-old (aging), H–H". Panels E"–H" show the merged images. Scale bar = 5 µm.
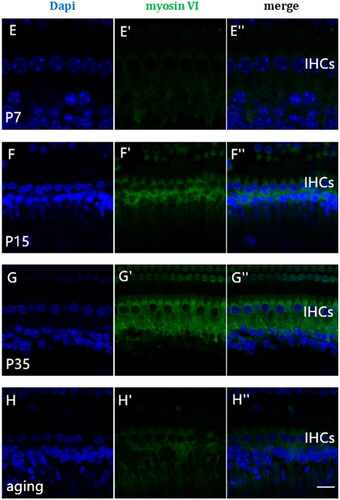
Figure 5. Variations in AP-2 and myosin Ⅵ immunofluorescence IMV in the cochleae of mice of different ages. A densitometric analysis of AP-2 and myosin Ⅵ expression in the IHCs of mice of different ages was performed. Regions of equal area (9 μm2) were selected for IMV measurement, and the results were analyzed by ANOVA. The data are expressed as the mean ± standard deviation of the values obtained in at least three independent experiments. The error bars represent standard deviation. AP-2 (red), myosin Ⅵ (green). *p<.05 vs. P7; **p<.05 vs. P35.
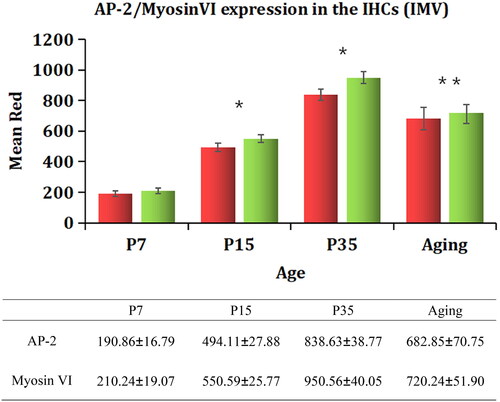
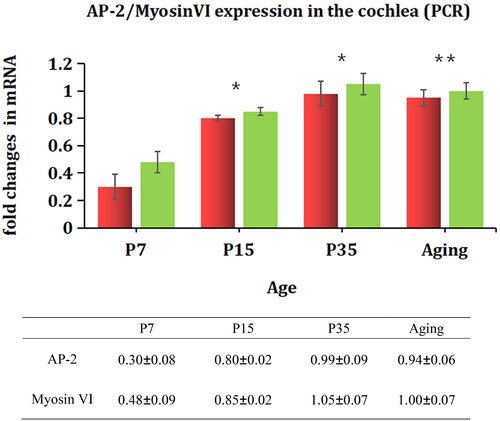
Figure 6. Variations in the expression of myosin Ⅵ and AP2 mRNAs in the cochleae of mice of different ages. The mRNA expression of AP-2 and myosin Ⅵ in the cochleae of mice was examined by quantitative real-time qRT-PCR. AP-2 (red), myosin Ⅵ (green). *p<.05 vs. P7; **p>.05 vs. P35.