
Figures & data
Figure 1. Comparison between ORL consultants and the different LLMs (ChatGPT4, Bard 2023.07.13, Claude 2) for all evaluated categories. Data shown as a scatter dot blot with points representing absolute values and bar width representing amount of individual values. Horizontal lines represent mean (95% CI). Normality distribution was tested with the D’Agostino and Pearson test. Multi-group comparisons were performed using the Kruskal-Wallis-Test. ns > .05, *p < .05, **p < .01, ***p < .001, ****p < .0001.
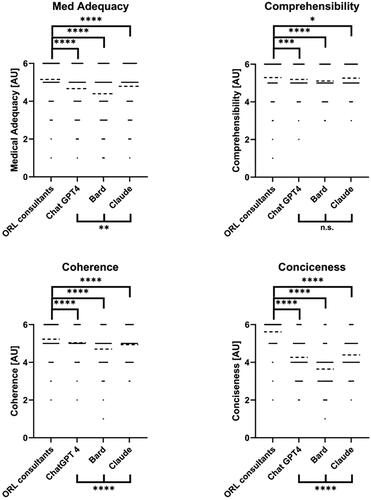
Figure 2. The number of characters per answer used by ORL consultants and the different LLMs (ChatGPT 4, Bard 2023.07.13, Claude 2). Data shown as a scatter dot blot with each point resembling an absolute value. Horizontal lines represent the median. Normality distribution was tested with the D’Agostino and Pearson test. Multi-group comparisons were performed using the Kruskal-Wallis-Test. ****p < .001.
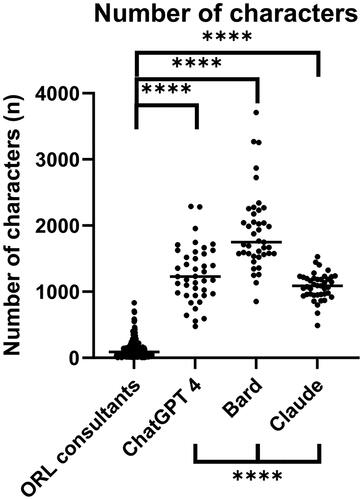
Table 1. Correlation Analysis for ratings for Medical Adequacy, Comprehensibility, and Coherence, Conciseness and the number of characters used. (ns >< .05, *p < .01, **p < .01, ****p < .001, ;****p < .0001).