Figures & data
Figure 1. Schematic representation of Glauber’s method for preparing nitric acid: sulphuric acid and saltpeter (potassium nitrate) are distilled from a retort; the product coming out of the beak is nitric acid, whose purity depends on the quality of the sulphuric acid, while potassium bisulphate is formed as a by-product and remains in the retort. © G. Montanari.
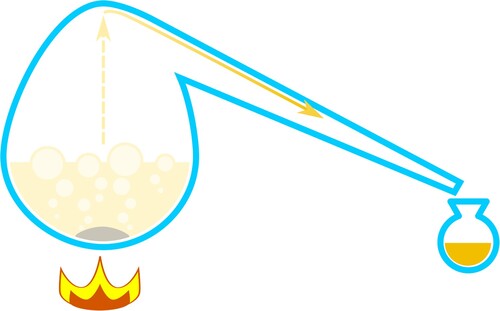
Figure 2. Tincture of Brazil before and after adding nitric acid. © G. Montanari.
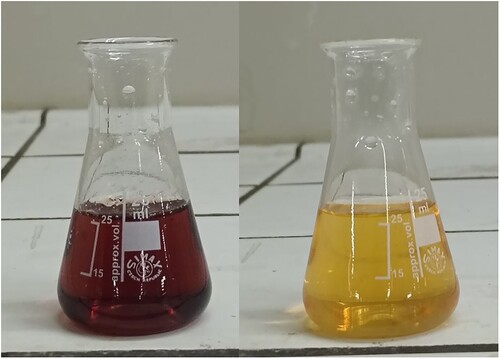
Figure 3. (a) Jacques Lamarre (gunsmith), Flintlock Sporting Gun of Empress Margarita Teresa of Spain (1651–1673), ca. 1670–73, Metropolitan Museum of Art, New York. (b) Detail of (a).
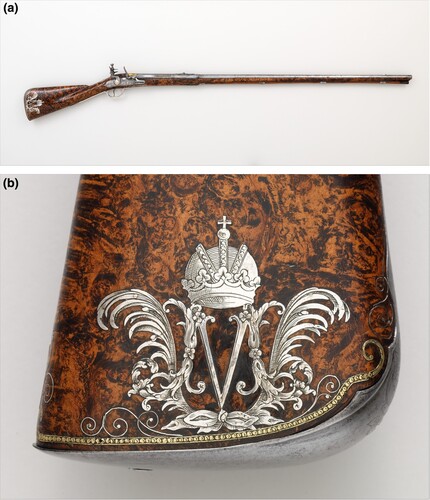
Figure 4. Tannic acid solutions treated with nitric acid: (A) 10% tannic acid solution; (B) 5% tannic acid solution; (C) 2.5% tannic acid solution; (1) freshly made solution; (2) solution after adding 68% nitric acid; (3) after heating the solution mixed with nitric acid. © G. Montanari.
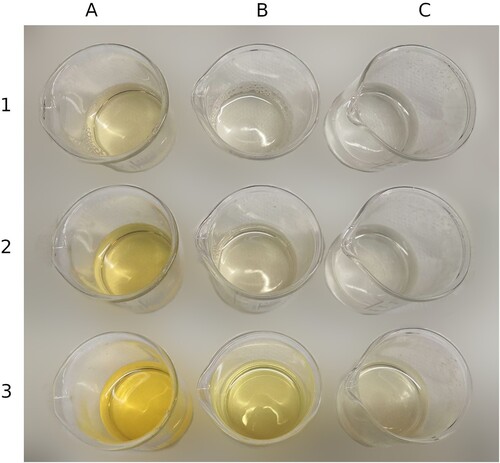
Figure 5. Results of the dyeing experiment using diluted nitric acid at 70°C and monitoring the effects of time on the achieved colour. © G. Montanari.
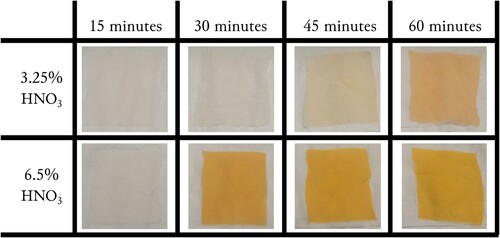
Figure 6. ATR-IR spectra of the silk before and after nitric acid treatment; dashed line represents the signal at 1333 cm−1. Data analysis and visualisation by the Authors.
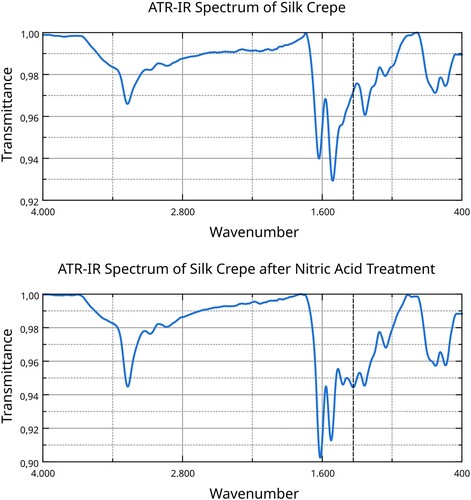
Figure 7. Silk tussah, undyed (A), after nitric acid treatment (B), with orange spot made by adding a drop of lye (C), treated with nitric acid and lye and yellow spot caused by a drop of hydrochloric acid (D). © G. Montanari.
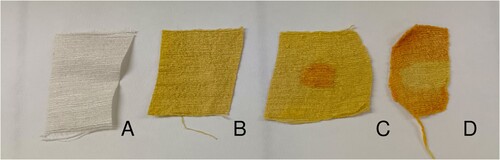
Figure 8. UV–Vis absorption spectra of silk proteins dissolved in different media. Data analysis and visualisation by the Authors.
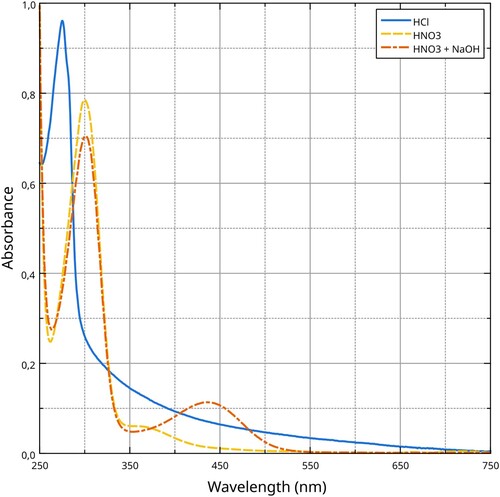
Figure 9. Handkerchief, ca. 1880, Printed in England, probably in Manchester, in imitation of an Indian tie-dyed handkerchief (bandana), © Victoria and Albert Museum, London.
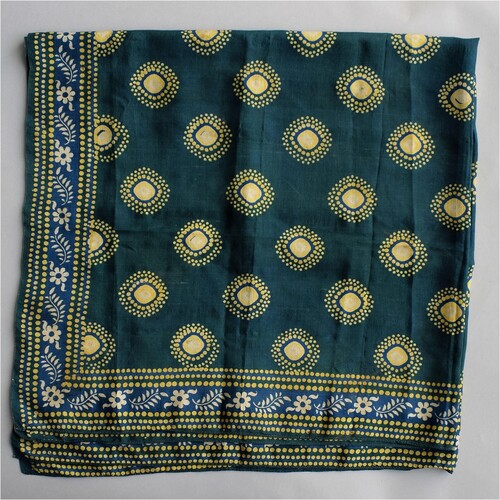
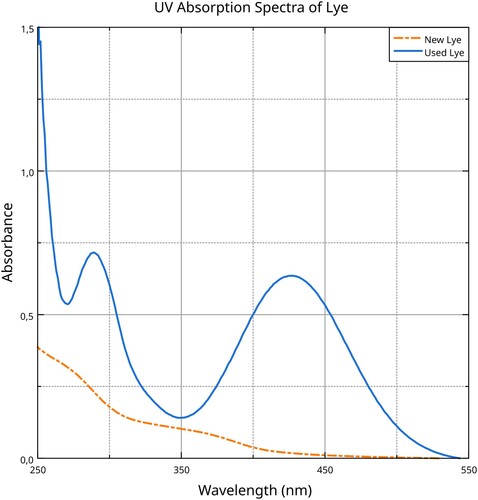
Figure 10. UV–Vis absorption spectra of lye before (new) and after (used) using it to dye orange the nitrated silk. Data analysis and visualisation by the Authors.