Figures & data
FIGURE 1. (A) Location of study site in relation to both the city of Chicago and Lake Michigan, and (B) the location of telemetry receivers (solid circles) and DO monitoring sondes (patterned circles) within the study site. Solid triangles in (A) show the location of the reference sites used for collection purposes (site 1 = North Shore Channel, site 2 = Busse Lake, site 3 = the Des Plaines River).
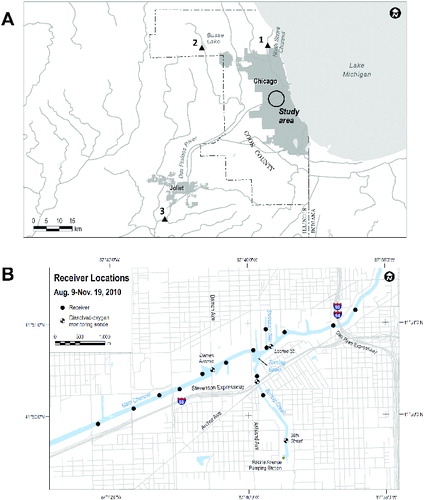
TABLE 1. Largemouth Bass present during each low DO event 4 d before and 4 d after the onset of a hypoxia event from July 2010 to October 2011. Delta is the change in fish presence, with a negative number indicating fish movement out of the area, 0 indicating no change, and a positive number indicating fish presence increasing after the low DO event. For reference, the event length (days) for each low DO event and mean DO concentration during the whole event is included.
FIGURE 2. (a) The probability of each of four individual Largemouth Bass (designated by fish ID number) located within Bubbly Creek during the 2010 season to depart the area as DO levels decreased; symbols denote individual fish. (b) The results of the predictive model compared with the mean probabilities of departure for the four Largemouth Bass located within Bubbly Creek during the 2010 season.
TABLE 2. Morphological and physiological metrics for eight Largemouth Bass collected from the study site in the Chicago Area Waterway System (CAWS) and three reference sites (North Shore Channel of the CAWS, Busse Lake, Des Plaines River) sampled immediately after collection in the field. Data were compared across sites using a one-way ANOVA followed by a Tukey–Kramer HSD test to separate means. Data are presented as mean ± SE; significance was assessed at α = 0.05 and indicated by bold text. Levels within a specific metric not sharing the same letter are significantly different.
FIGURE 3. (a) Hematocrit, (b) hemoglobin, and (c) MCHC for Largemouth Bass from the study site in the Chicago Area Waterway System (CAWS) and three reference sites (RS; North Shore Channel of the CAWS, Busse Lake, Des Plaines River) subjected to a low DO challenge of 2.0 mg/L for 6 h. Control treatment fish were held for 6 h at 6.5 mg/L. Error bars show ±1 SE. Lowercase letters represent statistical differences between individual bars, while uppercase letters represent significant differences across sites only; bars not sharing the same letter are significantly different from others in that group (α = 0.05). Sample sizes ranged from n = 7 to 11.
TABLE 3. Statistical results examining physiological and hematological differences in Largemouth Bass sampled from the study site in the Chicago Area Waterway System and three reference sites (North Shore Channel of the CAWS, Busse Lake, Des Plaines River) subjected to a hypoxia challenge of 2 mg/L for 6 h. Significance was assessed at α = 0.05 and indicated by bold text.
FIGURE 4. Concentrations of (a) plasma cortisol, (b) plasma glucose, and (c) plasma lactate for Largemouth Bass from the study site in the Chicago Area Waterway System (CAWS) and three reference sites (RS; North Shore Channel of the CAWS, Busse Lake, Des Plaines River) subjected to low DO challenge of 2.0 mg/L for 6 h. Control treatment fish were held for 6 h at 6.5 mg/L. Error bars show ±1 SE. Lowercase letters represent statistical differences between individual bars, uppercase letters represent significant differences across sites only, and an asterisk represent a significant treatment effect; bars not sharing the same letter are significantly different from others in that group (α = 0.05). Sample sizes ranged from n = 7 to 11.
FIGURE 5. Concentrations of (a) plasma sodium (Na+), (b) plasma potassium (K+), and (c) plasma chloride (Cl−) for Largemouth Bass from the study site in the Chicago Area Waterway System (CAWS) and three reference sites (RS; North Shore Channel of the CAWS, Busse Lake, Des Plaines River) subjected to low DO challenge of 2.0 mg/L for 6 h. Control treatment fish were held for 6 h at 6.5 mg/L. Error bars show ±1 SE, and lowercase letters represent statistical differences between individual bars; bars not sharing the same letter are significantly different from others in that group (α = 0.05) and lack of letters indicates no significant differences. Sample sizes ranged from n = 7 to 11.
FIGURE 6. The relationship between oxygen consumption (MO2) and percent saturation of the water for seven Largemouth Bass collected from the study site in the Chicago Area Waterway System (CAWS) and three reference sites (RS; North Shore Channel of the CAWS, Busse Lake, Des Plaines River). Mean Pcrit values (i.e., critical oxygen tension) for each population are indicated by dashed vertical lines with symbols matching consumption line symbols. Error bars show ±1 SE for both MO2 (vertical) and % saturation (horizontal).