Figures & data
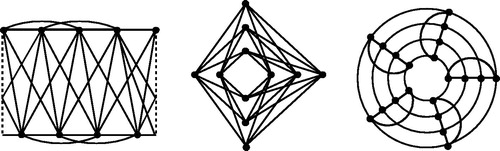
Fig. 1 Three graphs drawn in the plane so as to minimize the number of crossings. From left to right: K8 drawn with 18 crossings, drawn with 24 crossings, and
drawn with 10 crossings. Note that in the drawing of K8, the vertices in the top left and top right corners are identified.