Figures & data
Fig. 1 Comparison of the Type I error rate and power under the frequentist Z-test and Bayesian test based on the posterior probability for detecting treatment difference (left) and
(right).
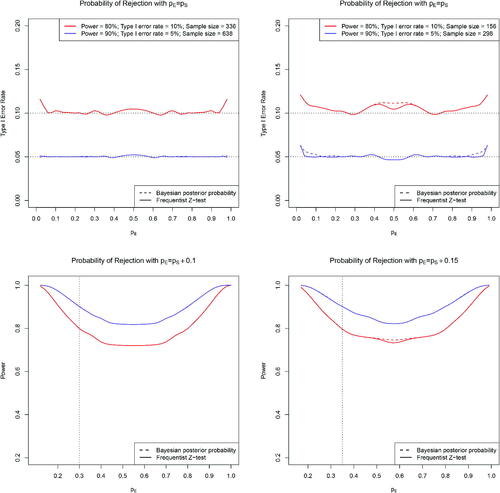
Fig. 2 The relationship between p-value and the posterior probability of the null in one-sided hypothesis tests with binary outcomes under sample sizes of 20, 50, 100, and 500 per arm, respectively.
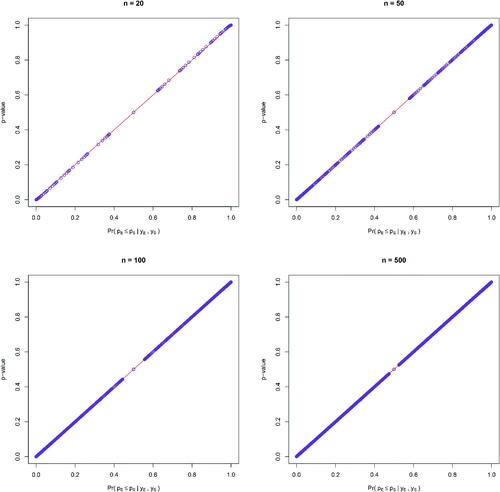
Fig. 3 Histograms of the differences between p-values and posterior probabilities of the null over 1000 replications in one-sided hypothesis tests with binary outcomes under sample sizes of 20, 50, 100, and 500, respectively.
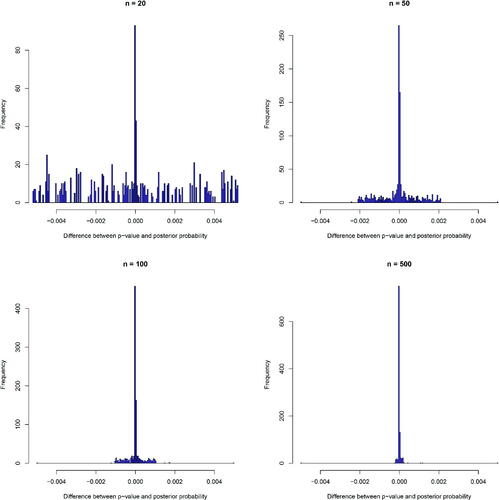
Fig. 4 The relationship between p-value and the transformation of the posterior probabilities of the hypotheses in two-sided tests with binary outcomes under sample sizes of 20, 50, 100, and 500, respectively.
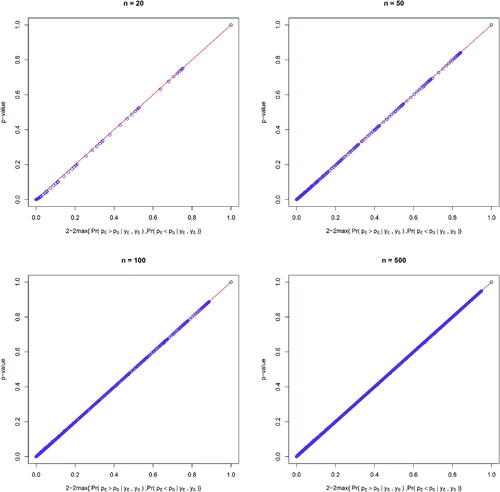
Fig. 5 The relationship between p-value and the posterior probability over 1000 replications under one-sided and two-sided hypothesis tests with normal outcomes assuming Jeffreys’ prior and the non-informative normal-inverse-gamma prior under sample sizes of 20, 50, and 100, respectively.
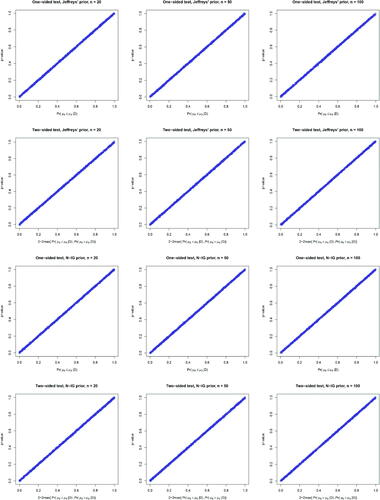
Fig. 6 The relationship between p-value and the posterior probability of the null over 1000 replications under one-sided hypothesis tests with outcomes generated from Gamma, Beta, and mixture normal distributions, assuming Jeffreys’ prior for the mean and variance parameters of normal distributions under sample sizes of 20 and 50, respectively.
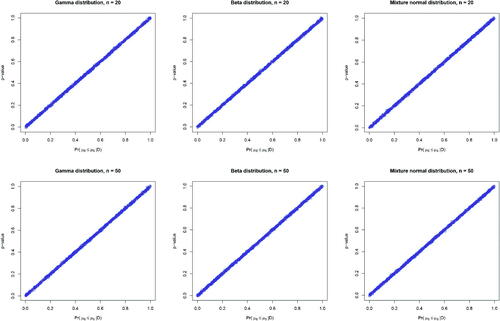
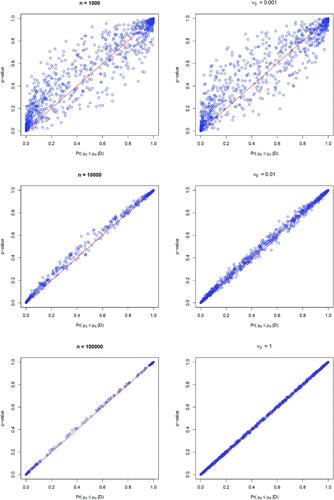
Fig. 7 The relationship between p-value and the posterior probability of the null over 1000 replications under one-sided hypothesis tests with normal outcomes; left panel: assuming a fixed informative normal-inverse-gamma prior under increasing sample sizes of 1000, 10,000, and 100,000 (from top to bottom), right panel: assuming a fixed sample size of 1000 with an increasing prior variance of 0.001, 0.01, and 1 (from top to bottom).