
Figures & data
Fig. 1 Location-scale transformation model. The transformation (left) and cumulative distribution function (right) are shown for the baseline configuration (i.e., and
) and different values of the location parameter
and of the scale parameter
.
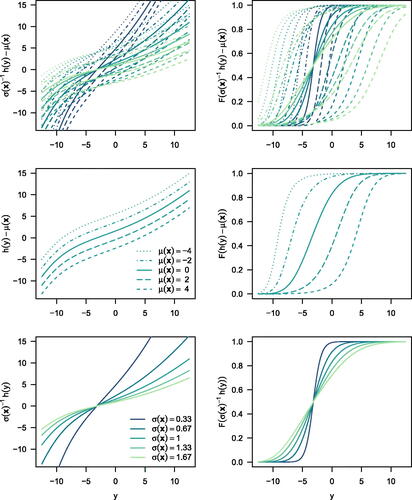
Fig. 2 Stratification. Distribution (top) and density (bottom) of postpartum blood loss conditional on delivery mode estimated by the stratified transformation model (left) and location-scale transformation model (right). In addition, the empirical cumulative distribution function is shown in the top row, in-sample log-likelihoods are given in the bottom row.
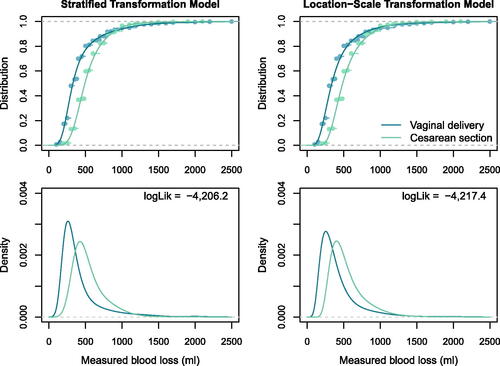
Fig. 3 Crossing hazards. The survivor functions of the two groups estimated by the nonparametric Kaplan-Meier method (step function) are shown along the estimates from the location-scale Weibull model (left) and the distribution-free location-scale transformation model (right).
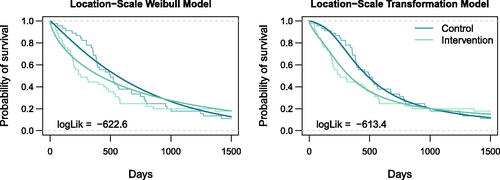
Fig. 4 Partial proportional hazards. Three annual quantile functions (0.25, 0.50, and 0.75th quantile) for DVCs (for a hypothetical Monday in 2002) estimated by three transformation models of increasing complexity. The in-sample log-likelihoods of the corresponding models are given in the panels.
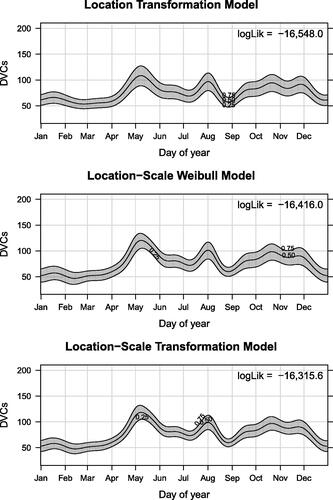
Table 1 Partial proportional hazards.
Fig. 5 Location-scale transformation tree. Female orgasm frequency in heterosexual relationships as a function of questionnaire variables reported by the female respondent.
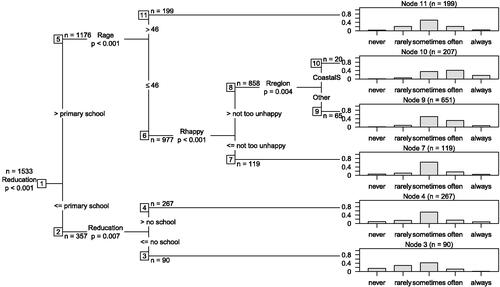
Fig. 6 Transformation additive models for location and scale (TAMLS). Conditional quantiles of head circumference along age estimated by the Box-Cox-t GAMLSS (BCT GAMLSS, top panel) and the TAMLS (bottom panel). The former model comprises four and the latter model two smooth terms.
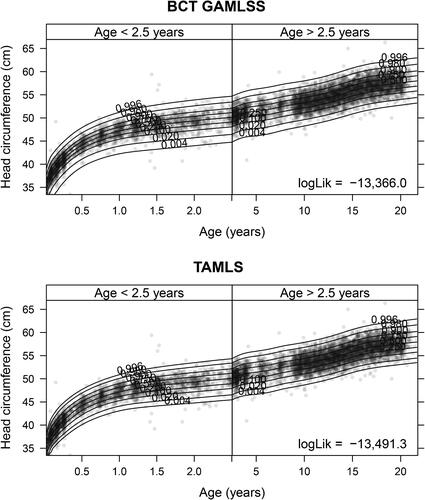
Table 2 Model selection.