
Figures & data
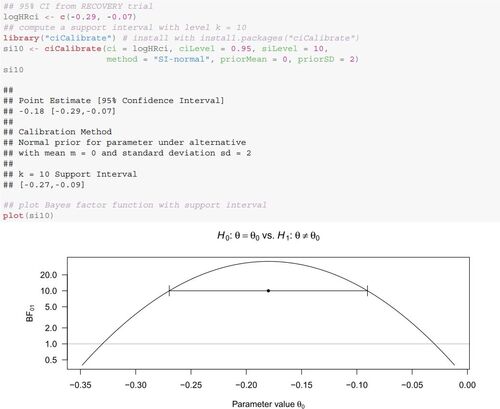
Figure 1: The RECOVERY trial (RECOVERY Collaborative Group Citation2021) found that dexamethasone treatment reduced mortality compared to usual care in hospitalized Covid-19 patients (estimated log hazard ratio with standard error
and 95% confidence interval from
to
). Assuming a normal likelihood
, the Bayes factor for contrasting
to
is shown as a function of the null value
. A unit-information normal distribution
centered around the clinically relevant log hazard ratio is used as prior for
under
. Support intervals for different support levels k indicate the range of log hazard ratios supported by the data.
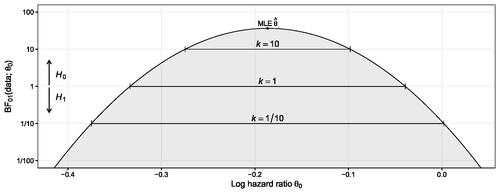
Table 1: Classifications of evidence for provided by Bayes factors
.
Figure 2: Comparison of prior distributions for the parameter under the alternative
in terms of the resulting support interval width and the highest level for which it is nonempty. A data model
is assumed in all cases. The prior scale/spread parameter is set to
. The normal prior (correct mean) has a mean equal to the parameter estimate
, while the normal prior (wrong mean) has a mean one standard deviation
away from
.
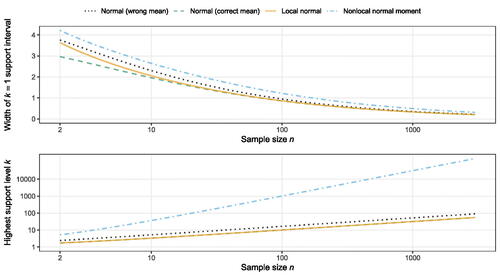
Figure 3: Mapping between confidence level and minimum support level k for different types of minimum support intervals.
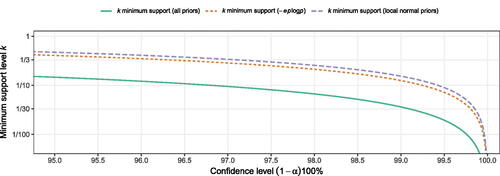
Figure 4: Different support intervals for the data from the RECOVERY trial. The normal prior is centered around and has unit variance
. The local normal prior also has unit variance
. The spread parameter of the nonlocal normal moment prior is
.
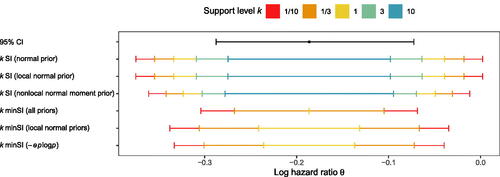
Table 2: Summary of confidence intervals (CI), support intervals (SI), and minimum support intervals (minSI) for an unknown parameter based on a parameter estimate
with standard error
.
Data Availability Statement
The point estimate and 95% confidence interval of the adjusted log hazard ratio were extracted from the abstract of RECOVERY Collaborative Group (Citation2021). All analyses were conducted in the R programming language version 4.3.0 (R Core Team Citation2023). Code and data for reproducing the results in this manuscript are available at https://github.com/SamCH93/ECoCI. A snapshot of the GitHub repository at the time of writing this article is archived at https://doi.org/10.5281/zenodo.6723249. An R package for calibration of confidence intervals to (minimum) support intervals is available at https://CRAN.R-project.org/package=ciCalibrate, see the Appendix for an illustration.