
Figures & data
Table 1 Average processing time (hr) required by the MI algorithms to generate 10 imputations for 100 datasets.
Fig. 1 Bias (a), mean squared error (b) and coverage (c) of the 6 MI algorithms for the random intercept variance component (simulated value range [0.09;0.30]) from (4). The black dashed line in panel (c) indicates the nominal coverage level, fixed at 0.95.
![Fig. 1 Bias (a), mean squared error (b) and coverage (c) of the 6 MI algorithms for the random intercept variance component σ12(u) (simulated value range [0.09;0.30]) from (4). The black dashed line in panel (c) indicates the nominal coverage level, fixed at 0.95.](/cms/asset/796a5133-ea0b-46d0-b0b4-e8ffe7ce8a31/utas_a_2259962_f0001_c.jpg)
Fig. 2 Bias (a), mean squared error (b) and coverage (c) of the 6 MI algorithms for the residual variance component (simulated value range [0.58;2.07]) from (4) per biomarker. The black dashed line in panel (c) indicates the nominal coverage level, fixed at 0.95.
![Fig. 2 Bias (a), mean squared error (b) and coverage (c) of the 6 MI algorithms for the residual variance component σe2(u) (simulated value range [0.58;2.07]) from (4) per biomarker. The black dashed line in panel (c) indicates the nominal coverage level, fixed at 0.95.](/cms/asset/b88c770e-b74a-4772-8660-0dd11876cca6/utas_a_2259962_f0002_c.jpg)
Fig. 3 Bias (a), mean squared error (b) and coverage (c) of the 6 MI algorithms for the residual correlation (simulated value range [–0.35;0.52]) from (4) per biomarker. The black dashed line in panel (c) indicates the nominal coverage level, fixed at 0.95.
![Fig. 3 Bias (a), mean squared error (b) and coverage (c) of the 6 MI algorithms for the residual correlation ρ(u) (simulated value range [–0.35;0.52]) from (4) per biomarker. The black dashed line in panel (c) indicates the nominal coverage level, fixed at 0.95.](/cms/asset/62da023b-cb96-4a4f-a223-ea9341f75bf2/utas_a_2259962_f0003_c.jpg)
Fig. 4 Average point (a) and standard error (b) estimates and t-test p-val’s (c) (over 10 imputations) of the intercept fixed effect for FIML and the imputation algorithms MICEPMM, MIPCA, and MIForest applied to the case study. The black dashed line in panel (c) indicates the significance level, fixed at 0.05.
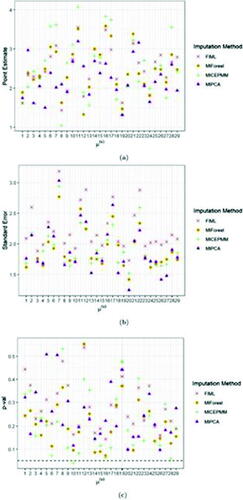
Fig. 5 Average point (a) and standard error (b) estimates and t-test p-val’s (c) (over 10 imputations) of the fixed effect for BMI for FIML and the imputation algorithms MICEPMM, MIPCA, and MIForest applied to the case study. The black dashed line in panel (c) indicates the significance level, fixed at 0.05.
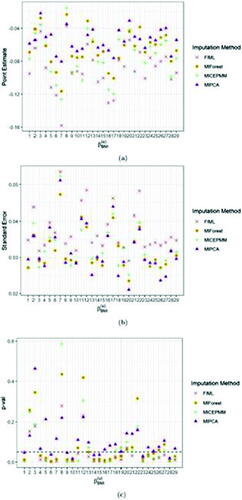
Fig. 6 Average point (a) and standard error (b) estimates (over 10 imputations) of the random intercept for FIML and the imputation algorithms MICEPMM, MIPCA, and MIForest applied to the case study.
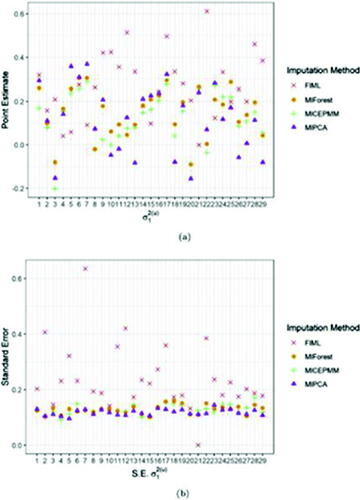
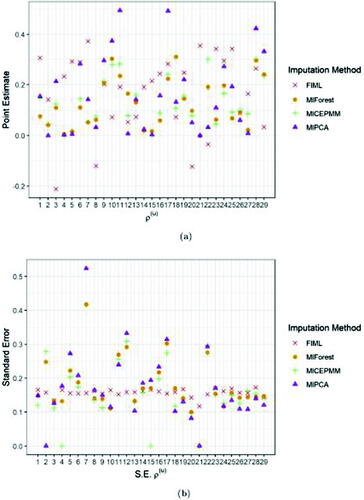
Fig. 7 Average point (a) and standard error (b) estimates (over 10 imputations) of the residual correlation for FIML and the imputation algorithms MICEPMM, MIPCA, and MIForest applied to the case study.
Supplementary Material.zip
Download Zip (5.2 MB)Data availability statement
Data for the case study is available upon request to Edwin R. van den Heuvel ([email protected]).