
Figures & data
Fig. 1 Bracket for eight-team single-elimination tournament.
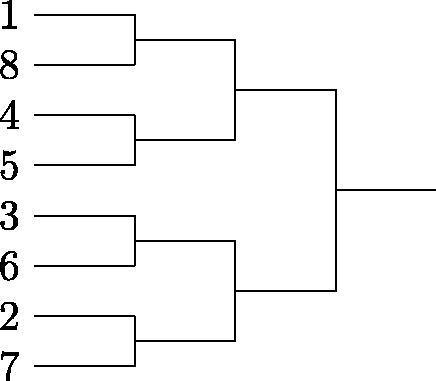
Fig. 2 MOV conformal predictive distribution for South Carolina versus Oregon State with using regular season data from 2019 to 2020 NCAA women’s basketball season. The blue dotted line identifies a MOV for South Carolina of 5, that is, South Carolina (home) beating Oregon State (away) by five points, with
identified by the red dashed line.
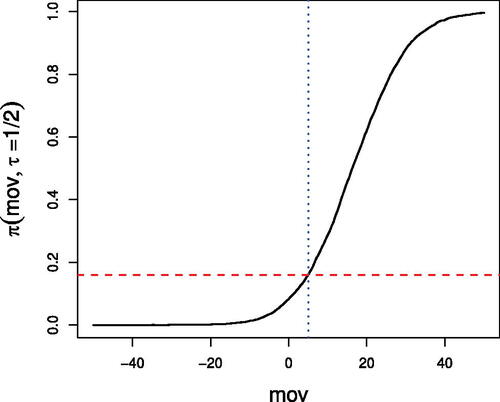
Table 1 Top 10 NCAA women’s teams for 2019–2020 season.
Table 2 Top 10 NCAA men’s teams for 2019–2020 season.
Table 3 Training and validation set sample sizes spanning 2011–2012 and 2022–2023 seasons.
Table 4 Situations for women’s bubble teams.
Table 5 Probabilities of making NCAA tournament field for women’s bubble teams for 2019–2020 season.
Fig. 3 Expert bracket win probabilities (left) and cumulative win probabilities (right) for top 10 women’s teams during the 2019–2020 season.
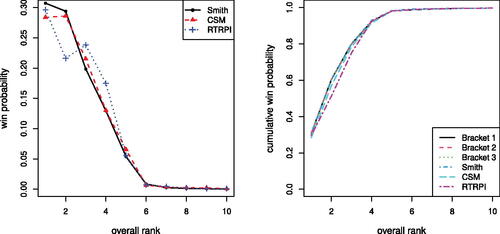
Table 6 March Madness win probabilities given exemplar brackets for top ranked women’s teams.
Fig. 4 Round-by-round win probabilities for Baylor and South Carolina constructed with expert brackets from Michelle Smith (top left), College Sports Madness (top right) and RTRPI (bottom middle). The values shown indicate the probabilities of a team moving on from a particular round.
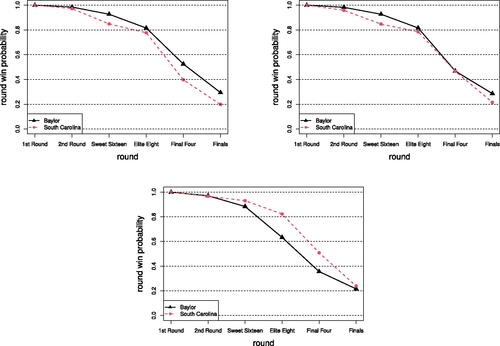
Fig. 5 Empirical calibration comparison for NCAA women’s and men’s basketball for 2011–2012 to 2022–2023 post-seasons for methods outlined in Section 3.
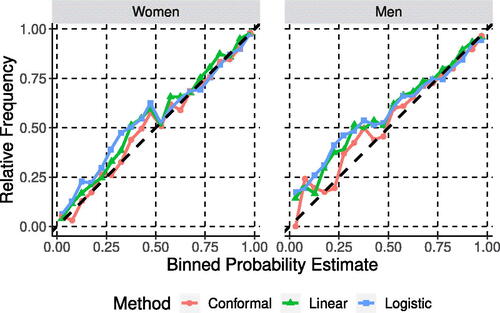
Fig. 6 Relative log-loss comparison for NCAA women’s and men’s basketball for win probability estimates associated with 2011–2012 to 2022–2023 post-seasons for methods outlined in Section 3.
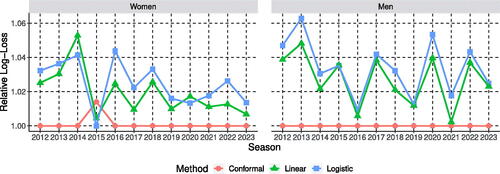
Table 7 Relative log-loss for NCAA men’s and women’s basketball win probability estimates by league.
Table 8 Proportion of games corrected predicted for 2011–2023 seasons.
Table 9 log-loss performance of conformal win probabilities based on model (16) to Kaggle March Madness leaderboards for men’s March Madness, with higher percentiles indicating better performance.
Table 10 Kaggle methods used for comparison to conformal win probability.
Table 11 log-loss comparison of conformal win probabilities to well performing KMMLM competition models for 2015–2023 NCAAW March Madness tournaments.
Table 12 log-loss comparison of conformal win probabilities to well performing KMMLM competition models for 2015–2023 NCAAM March Madness tournaments.