
Figures & data
Table 1: Example 1: but X and Y are dependent.
Figure 1: Example with a distribution on 4 points, from . Top: plot of Y versus X. Bottom left: plot of pairwise distances of Y versus those of X. Bottom right: doubly centered distances
of Y versus those of X.
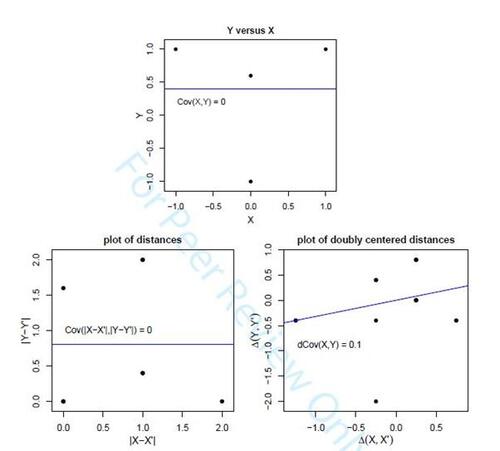
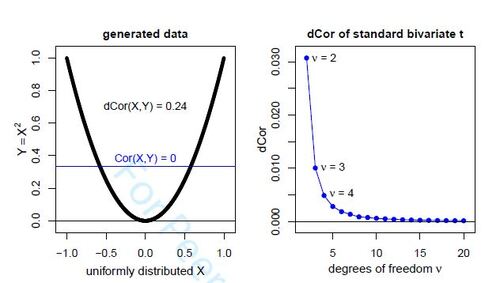
Figure 2: Left: dependent variables generated in Example 3, with horizontal regression line illustrating that X and Y are uncorrelated. Right: Plot of the distance correlation of the standard bivariate t-distribution in Example 4, for a range of .
Supplemental material