Figures & data
Table 1. Summary of the analytical parameters.
Figure 1. Typical heart tissue chromatograms of (a) carbonyl proteins in guanidine detected after reaction with 2,4-dinitrophenylhydrazine at 370 nm and (b) malondialdehyde in butanol detected after reaction with thiobarbituric acid at 532 nm including blanks (gray lines). The mobile phase was pH 6.9 100 mM ammonium acetate buffer and acetonitrile (1 + 1). The stationary phase was a reverse phase C18 column.
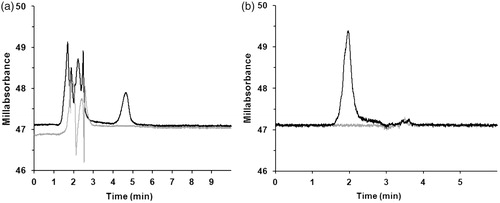
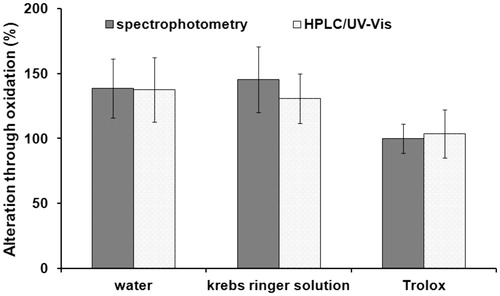
Figure 2. Increase of malondialdehyde in heart tissue following treatment with 5% hydrogen peroxide.
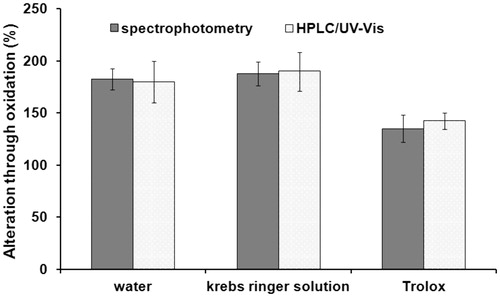
Figure 3. Increase of carbonyl proteins in heart tissue following treatment with 5% hydrogen peroxide.