Figures & data
Figure 1. BID cross-sectional diagram and gas flow. Redrawn from Shinada et al. (Citation2012).
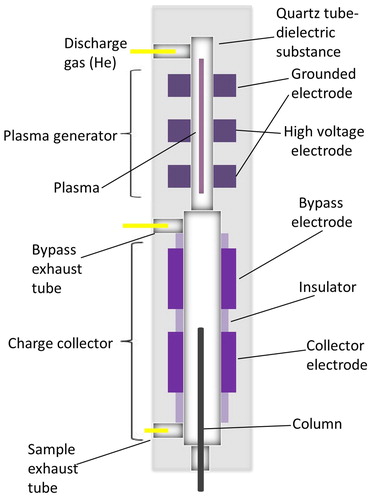
Figure 2. Ionization of the analyte (orange bowl) in a dielectric barrier-discharge sustained in He as plasma gas.
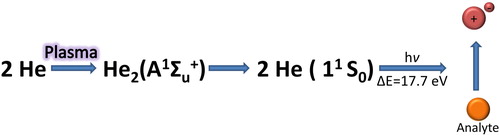
Figure 3. Effect of the purge flow for aromatic compounds at flow rates of 0, 1, 3, 5, and 10 mL/min. The error bars represent ± one standard deviation.
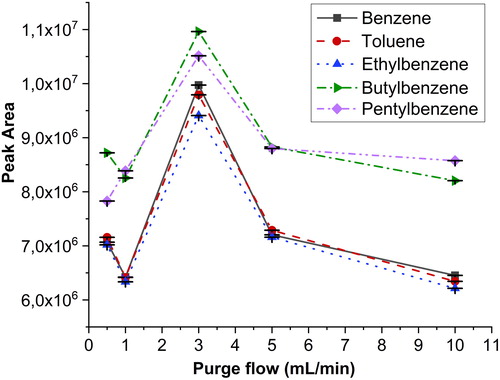
Figure 4. Diagram demonstrating the effect of the discharge gas flow rate for anilines at concentrations of 10 ng/μL, 100 ng/μL, and 1 μg/μL) and gas flow rates of 25, 50, 75, and 100 mL/min. The error bars represent ± one standard deviation. For the higher concentration, the left axis applies, and for the two lower concentrations, the right axis applies.
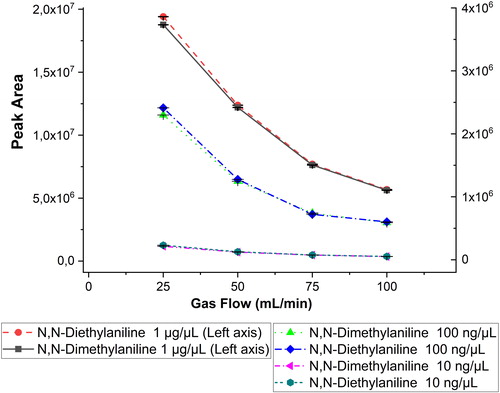
Figure 5. Comparison of chromatograms for four groups with the BID and the FID at 100 ng/μL: esters, upper left; alkanes, lower left; cyclic, upper right; and aromatic, lower right. Analytical conditions: injector temperature 250 °C; column flow 1.08 mL/min, 20:1 split; discharge gas flow 50 mL/min; oven initially at 50 °C (3 min) and increased at 20 °C/min to 250 °C (4 min).
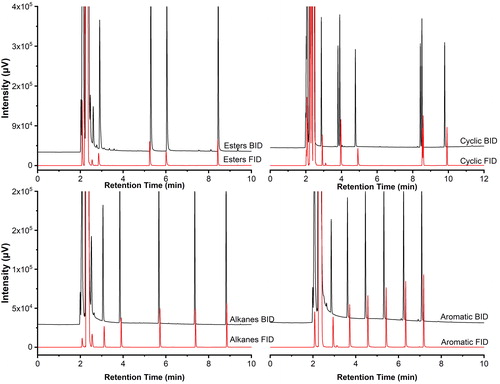
Table 1. Chromatographic resolution obtained for the BID and FID using identical separation conditions for adjacent peak pairs.
Table 2. Comparison of the limit of detection (LOD), limit of quantification (LOQ), and relative standard deviation (RSD) of the GC-BID and GC-FID.
Figure 6. Normalized sensitivity of the BID in comparison to the FID. Normalized sensitivity: (compound sensitivity-lowest sensitivity from all 30 compounds)/lowest sensitivity from all 30 compounds. Compound numbers: (1) N,N-dimethylaniline, (2) N,N-diethylaniline, (3) isovalevaldehyde, (4) benzaldehyde, (5) 1-bromo-3-chloropropane, (6) 1-bromohexane, (7) 1-bromodecane, (8) phenol, (9) 2,4-dichlorophenol, (10) 4-chlorophenol, (11) 2-propanol, (12) 1-butanol, (13) isoamyl alcohol, (14) 1,4-butanediol, (15) 1-octanol, (16) heptane, (17) decane, (18) dodecane, (19) cyclohexane, (20) cyclodecane, (21) cyclododecane, (22) benzene, (23) toluene, (24) ethylbenzene, (25) butylbenzene, (26) pentylbenzene, (27) ethyl acetate, (28) butyl acetate, (29) 2-methoxy-1-propyl acetate, and (30) 2-butoxyethyl acetate.
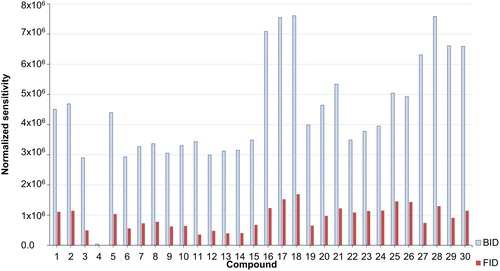
Figure 7. Concentration dependence of the response factors (peak area/mass) for four compounds at five concentrations. The error bars represent ± one standard deviation.
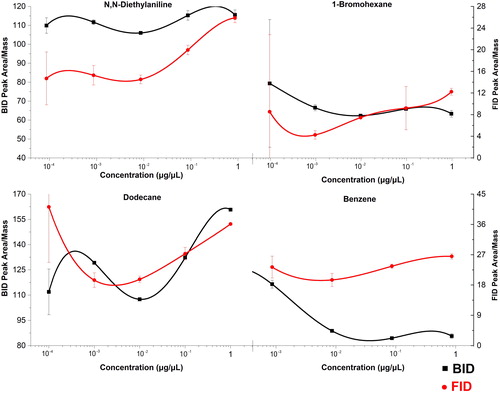
Figure 8. Diagram with the specific peak area (area per mass) values per compound for both detectors. Analytes: (1) cyclohexane, (2) cycloheptane, (3) cyclododecane, (4) cyclopentanone, (5) cyclohexanone, (6) cyclodecanone, (7) cyclododecanone, (8) chlorobenzene, (9) 1,2-dichlorobenzene, (10) 1,2,3-trichlorobenzene, (11) 1,2,3,4-tetrachlorobenzene, (12) chloroheptane, (13) chlorooctane, (14) chlorodecane, (15) chlorododecane, (16) 1-pentanol, (17) 1-hexanol, (18) 1-heptanol, (19) 1-octanol, (20) 1-nonanol, (21) 1-decanol, (22) n-hexane, (23) n-heptane, (24) n-octane, (25) n-decane, (26) n-dodecane, (27) n-tetradecane, (28) naphthalene, (29) acenaphthene, (30) fluorene, (31) phenanthrene, (32) fluoranthene, (33) pyrene, (34) chrysene, (35) benzene, (36) toluene, (37) ethylbenzene, (38) propylbenzene, (39) butylbenzene, and (40) pentylbenzene.
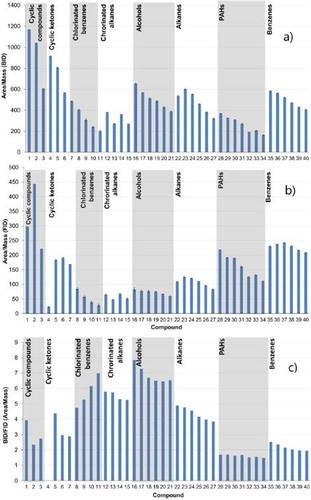
Figure 9. Response of the barrier discharge ionization detector (BID) and flame ionization detector (FID) for alkane standards C10-C17 at 1 ng/μL. The analytical conditions are the same as in .
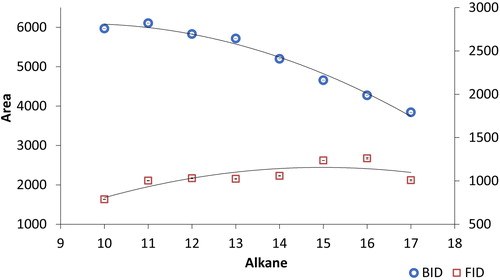
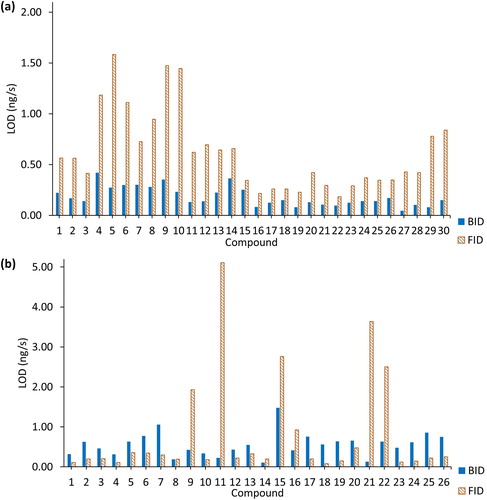
Figure 10. Comparison of the limits of detection (LODs) for the two detectors: (a) calculation when the value of the signal-to-noise ratio (S/N) equals to 3. The compounds on the x axis are identified in . (b) Use of the height of the blank measurement (n = 5) to calculate the limit of detection using the 3σ/S relationship where S is the slope or sensitivity.