Figures & data
Figure 1. Volume 32 (1772–1773) of Philosophical Transactions of the Royal Society includes this sample table with the Royal Society ‘Invitation to make Meteorological Observations’, written in 1722. Image in the public domain: retrieved from Biodiversity Heritage Library.
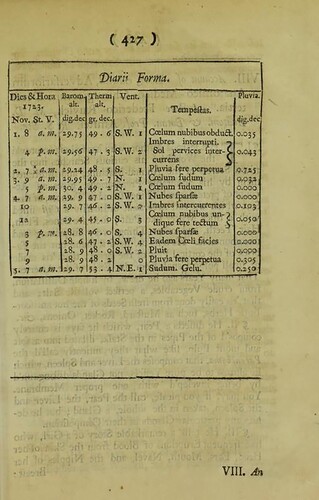
Figure 2. Highest and lowest, monthly thermometer readings for Borgensund in 1763, as reported by Hans Strøm in Skrifter.
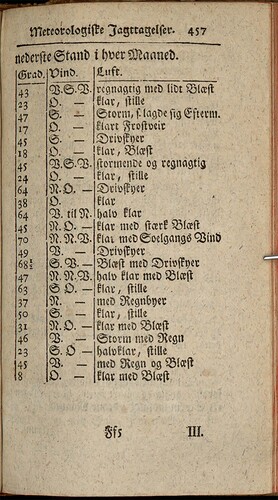
Figure 3. Four our columns of weather data for the month of January, with respective headings for values (left to right); Days of the month, barometer, thermometer, wind. (Berlin, 1765).
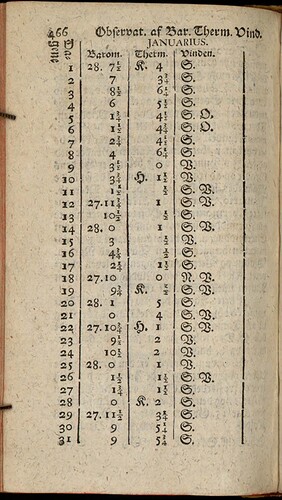
Figure 4. Johan Daniel Berlin’s barometer, with measurement scale for summer, on the left side, and scale for winter, on the right. Image by Ivonne Geisler, NTNU University
Museum.
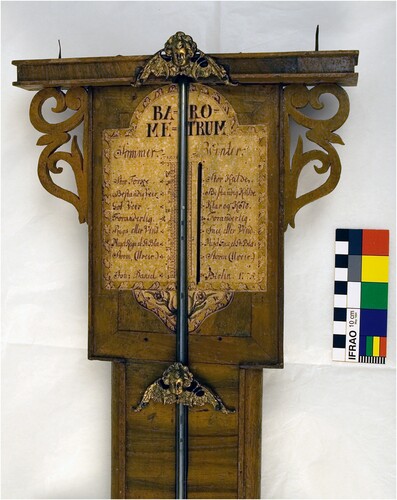
Figure 5. Daytime-weather descriptions shown for 31 days of January, in the left column. Nightly readings shown, in the right column. Excerpt from Berlin’s ‘Observat. af Bar. Therm. Vind og Veiret, for Aar. 1764, i Tronh.’ as published in Skrifter.
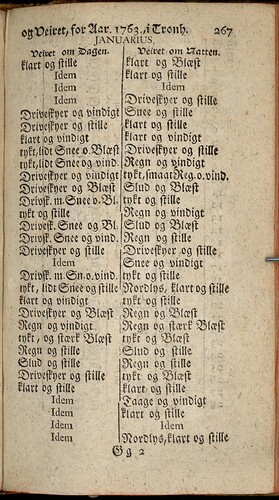
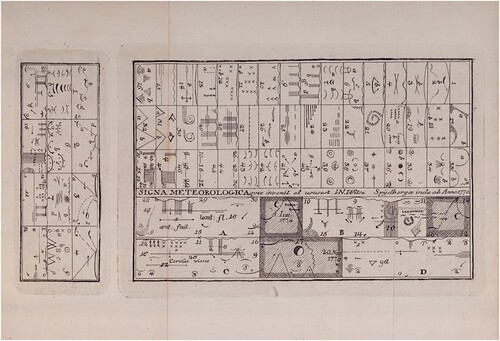
Figure 6. Wilse’s Meteorographia compendiosa in which Wilse unveiled an international system of meteorological symbols. Circles, arrows, lines and spirals indicate sun, fog, rain and wind- strength levels from storm to calm; as well as symbols for wind direction. Illustration courtesy of the Gunnerus Library in Trondheim.