
Figures & data
Figure 1. The 1582 map of Antonino Saliba. (Image: Herzog August Library Wolfenbüttel, Signature K 3,6; License: CC BY-SA 4.0. https://kartenspeicher.gbv.de/item/hab_mods_00007813)
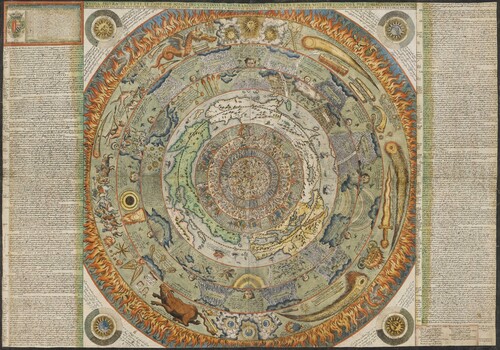
Figure 2. Saliba employed a polar azimuthal projection. This entails projecting the globe (but oftentimes, in practice, only a single hemisphere) onto a flat plane centred on and perpendicular to the Earth's axis. Distortion increases with distance away from the central point. However, Saliba restricted his map to the region spanned by the equator and 50 degrees latitude, and therefore the distortion is limited. (Figure by the author.)
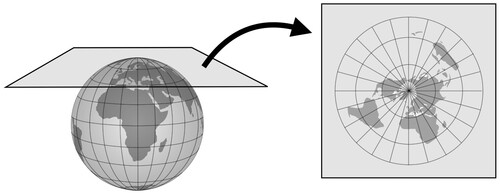
Table 1. A comparison of the order in which the comets are presented in Sordi's and Saliba's works.
Table 2. Text comparison of Saliba vs. Sordi.