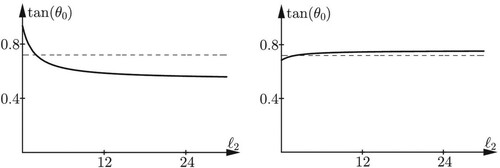
Publication Cover
Applicable Analysis
An International Journal
Volume 101, 2022 - Issue 15
1,294
Views
7
CrossRef citations to date
0
Altmetric
Research Article

The Ekman spiral for piecewise-constant eddy viscosity

ORCID Icon
Pages 5528-5536 | Received 18 Dec 2020, Accepted 19 Feb 2021, Published online: 08 Mar 2021

Figures & data

Figure 1. Plots of tan(θ0) as a function of 2 for 1=2, h1=0.7, and two different values of h2, namely h2=1.6 (left) and h2=3.4 (right). The dashed horizontal line represents the solution with no bottom layer, formula (Equation23), independent of 2.

Figure 1. Plots of tan⁡(θ0) as a function of ℓ2 for ℓ1=2, h1=0.7, and two different values of h2, namely h2=1.6 (left) and h2=3.4 (right). The dashed horizontal line represents the solution with no bottom layer, formula (Equation23(23) tan⁡(θ0)=(1+ℓ12)sinh⁡(2h1)+2ℓ1cosh⁡(2h1)+(1−ℓ12)sin⁡(2h1)(1+ℓ12)sinh⁡(2h1)+2ℓ1cosh⁡(2h1)−(1−ℓ12)sin⁡(2h1),(23) ), independent of ℓ2.

Data availability

The plots in Figure are easily generated from Equation (Equation21).