Figures & data
Table 1. Part 2 – The number of hours worked – OLS.
Table 2. Probability of being employed – Linear probability model.
Table 3. The number of hours worked per month, by poverty status and by region.
Table 4. The probability of employment, by poverty status and by region.
Table
Table
Table
Table
Table
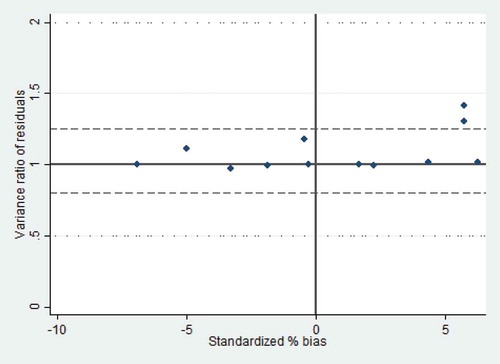
1. Variance ratios of disturbance - Kernel matching using the minima-maxima technique
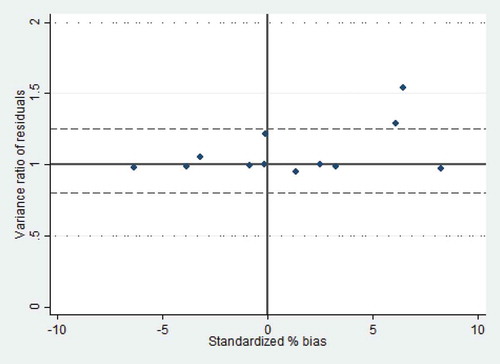
2. Variance ratios of disturbance - Kernel matching using the trimming technique
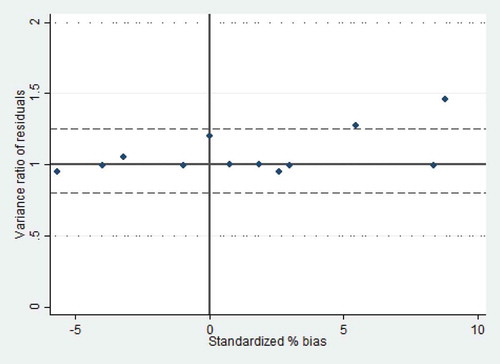
3. Variance ratios of disturbance - Mahalanobis matching
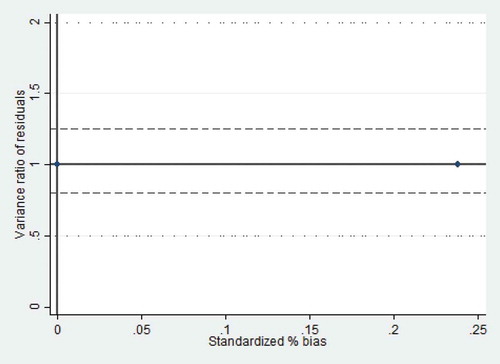
4. Variance ratios of disturbance - Nearest neighbour matching