
Figures & data
Table 1. Summary statistics.
Figure 1. Distribution of intensive margins.
This figure displays the median, the and the
percentile of intensive margins for all the countries in the sample.
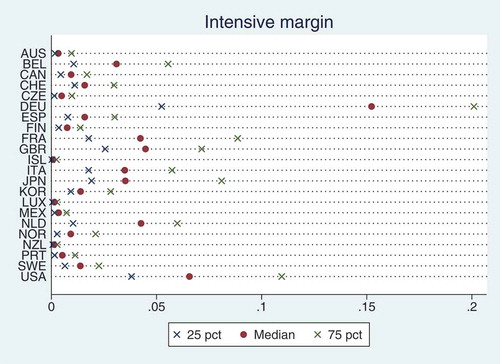
Figure 2. Distribution of extensive margins.
This figure displays the median, the 25th and the 75th percentile of extensive margins for all the countries in the sample.
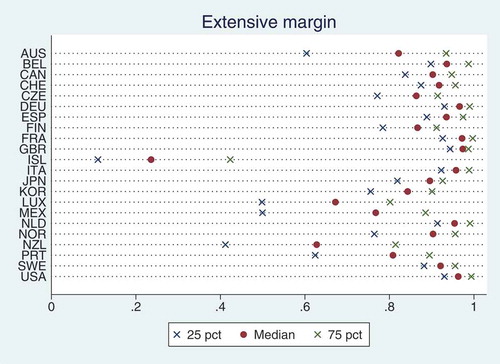
Figure 3. IRFs for intensive margins, full sample.
This figure displays mean impulse response functions of the intensive margin of exports to a one standard deviation shock in world prices. IRFs are calculated using all the countries in the sample.
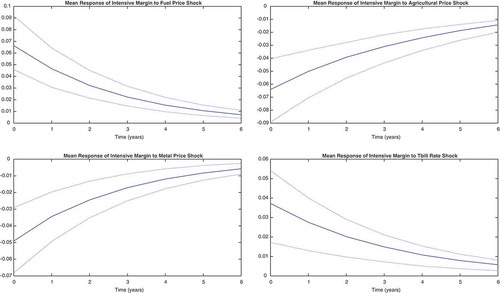
Figure 4. IRFs for extensive margins, full sample.
This figure displays mean impulse response functions of the extensive margin of exports to a one standard deviation shock in world prices. IRFs are calculated using all the countries in the sample.
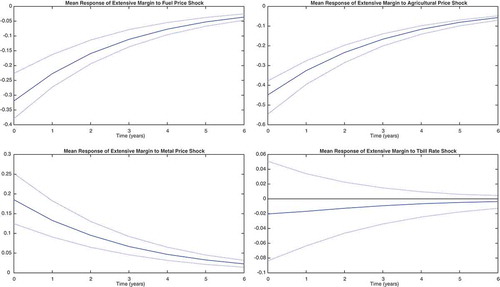
Figure 5. Peggers IRFs.
This figure displays mean impulse response functions of export margins to a one standard deviation shock in world prices. IRFs are calculated using countries classified as peggers. The first two rows display the responses of intensive margins while the last two rows display the responses of extensive margins.
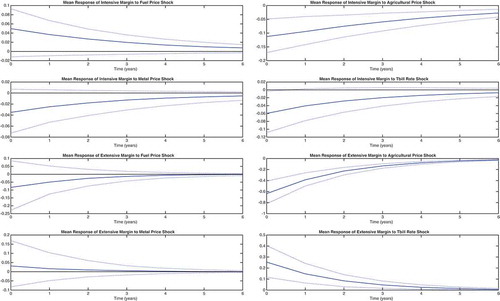
Figure 6. Floaters IRFs.
This figure displays mean impulse response functions of export margins to a one standard deviation shock in world prices. IRFs are calculated using countries classified as floaters. The first two rows display the responses of intensive margins while the last two rows display the responses of extensive margins.
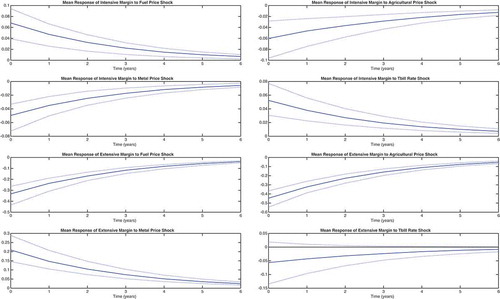
Figure 7. IRFs differences between peggers and floaters.
This figure displays the difference, with confidence interval, between peggers and floaters for mean impulse response functions. The first two rows display the results for intensive margins while the last two rows display the results for extensive margins.
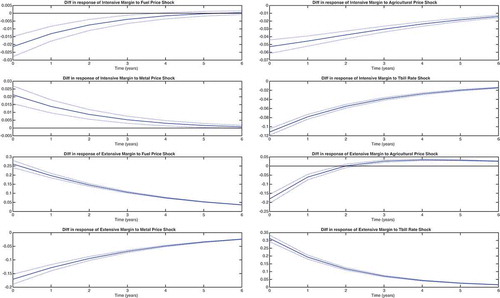
Table 2. Controlling for the exchange rate regime.
Table 3. Controlling for the great trade collapse.
Figure A1. Distribution of extensive margins.
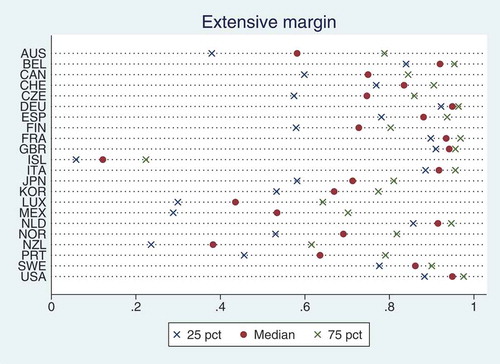
Table A1. Summary statistics with extensive margins calculated as Eaton and Fieler (Citation2019).
Figure A2. Full sample IRFs.
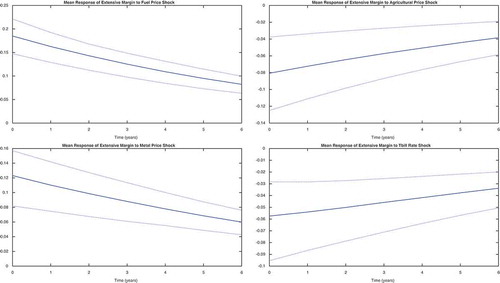
Figure A3. Floaters IRFs.
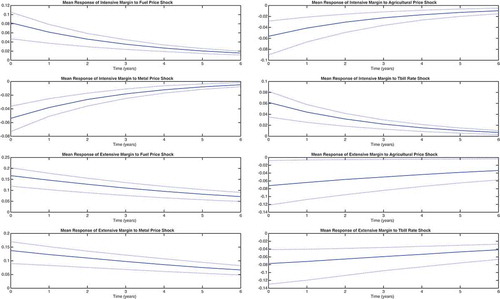
Figure A4. Peggers IRFs.
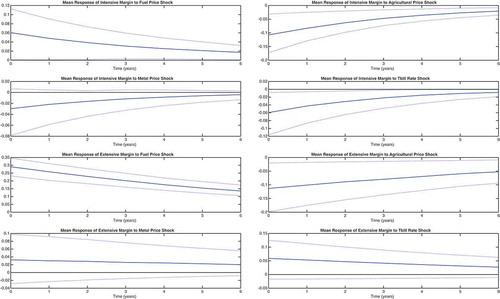
Figure A5. IRFs differences between peggers and floaters.
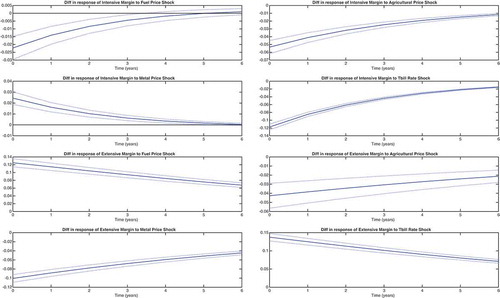
Table A2. Data sources and transformations.
Table A3. List of countries and their classification.