
Figures & data
Table 1. Descriptive statistics of the variables
Figure 1. Time profiles of the variables.
Panel A: The log levels
Panel B: The growth rates of the variables
Source: Authors’ own calculation.
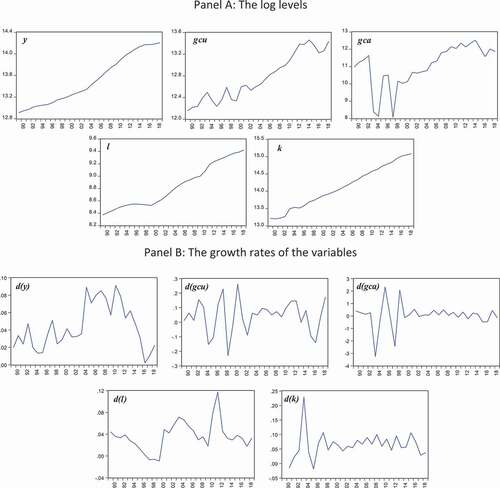
Figure 2. Oil revenues and the price of Arab Light crude.
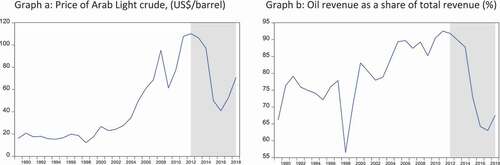
Table 2. Long-run elasticities using ARDL, FMOLS, DOLS and CCR
Table 3. Final ECM specification and test results
Supplemental material