
Figures & data
Table 1. Descriptive statistics of the study variables for the sample of Kansas farms (N = 9,531) from 2009 to 2018.
Figure 1. Average dollars received by the sample farms per payment type and year for the period 2009–2018.
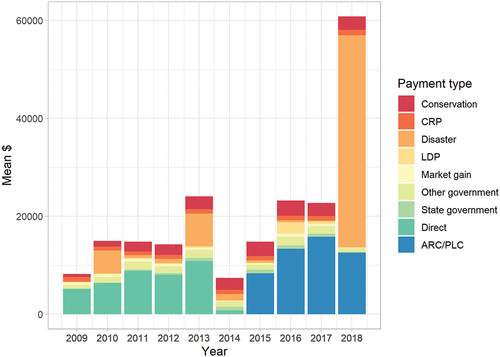
Figure 2. Percentage of sample farms that received different government payments.
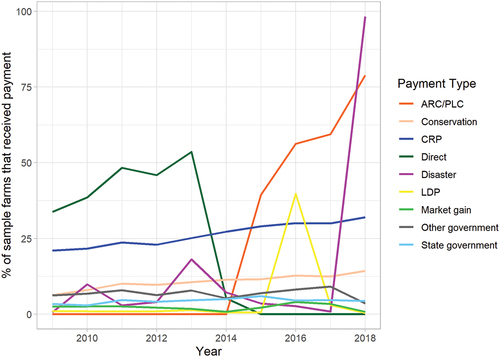
Table 2. Results of instrumental variables GMM regression on farm output for Kansas crop farms for the period 2009 to 2018.
Table 3. Average marginal effects of government payments on productivity .
Figure 3. Evolution of aggregate TFP (i.e. lnTFPt) over the 2011–2018 period (2011 = 1) for Kansas crop farms.
Table A1. Results of instrumental variables GMM regression on farm output for Kansas crop farms for the period 2009 to 2018-government payments as dummy variables.
Table A2. Results of instrumental variables GMM regression on farm output for Kansas crop farms for the period 2009 to 2018-combined government payments.
Table A3. Average marginal effects of government payments on productivity for the models where government payments are aggregated in different groups.
Table A4. Results of instrumental variables GMM regression on farm output for Kansas crop farms for the period 2009 to 2018-no government payments.