
Figures & data
Figure 1. The analytical framework of land finance, adaptive expectations, and residential land price.
Figure 2. Schematic Diagram of the Spatial Distribution of the YRDUA.
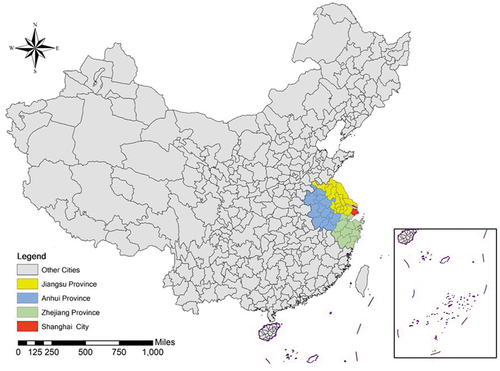
Table 1. Subordination of 41 cities in the Yangtze River Delta.
Figure 3. Spatial heterogeneity diagram of Residential Land Prices in the YRDUA.
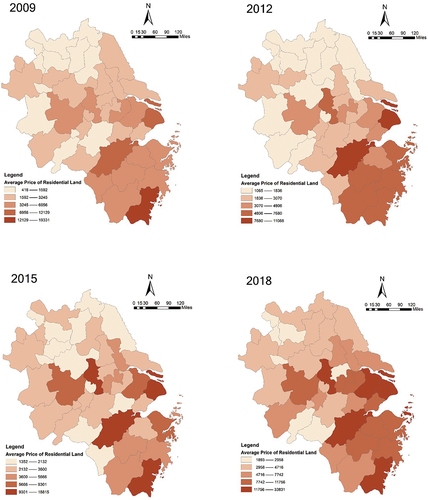
Table 2. Descriptive statistics of the variables.
Table 3. Results of classical linear panel data model regression.
Table 4. Results of Lagrange multiplier statistic test.
Table 5. Results of Hausman test of the spatial lag model.
Table 6. Results of LR test.
Table 7. Results of dynamic spatial panel data model of individual double fixed effects.
Table 8. Results of decomposition of dynamic spatial panel data model effects.
Table 9. Results of robustness test.
Table 10. Results of GTWR model.
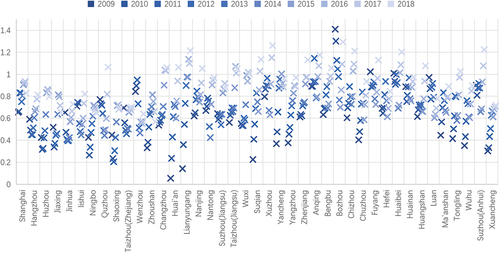
Figure 4. Spatio-temporal variation pattern of the correction coefficients of Residential land prices.
Data availability statement
The data and code used in this study are available on request from the first author.