Figures & data
Figure 1. Average point differentials: Team UAS and main competitors.
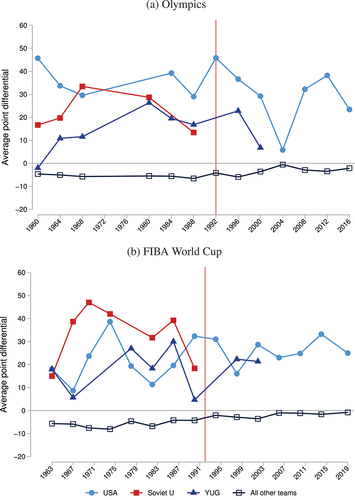
Figure 2. Effort and risk-taking over time.
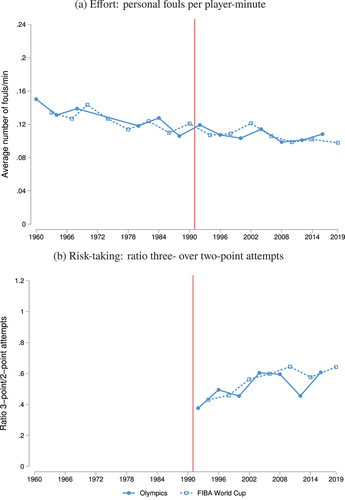
Table 1. Association of competing with a superstar and effort.
Table 2. Association of competing with a superstar and risk-taking.
Figure 3. Effort of treated and non-treated teams before and after the FIBA reform.
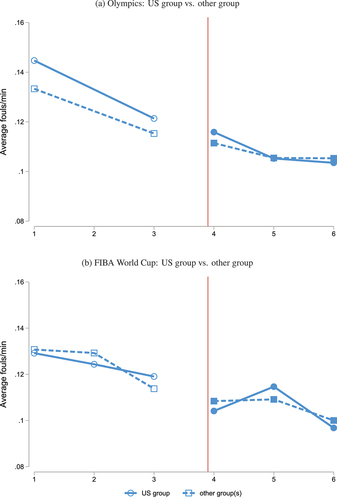
Table 3. Effect of 1991 reform on effort – difference-in-difference estimates.
Table 4. Association of competing with a superstar and effort – alternative effort measures.
Table A1. Association of competing with a superstar and effort – alternative specification.
Table A2. Association of competing with a superstar and risk-taking – alternative specification.
Table A3. Effect of 1991 reform on effort – alternative event-study model.
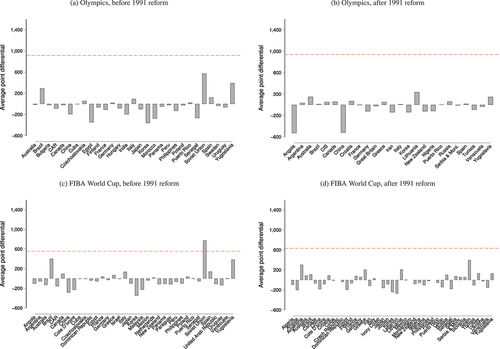
Figure A1. Cumulative point differentials for all teams.