
Figures & data
Figure 1. FDI inflows, global and by group of economies 1990–2020.
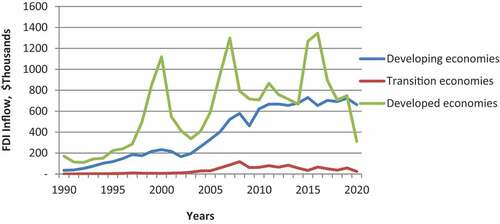
Table 1. FDI decomposition by sector and by technology.
Table 2. FDI variables with definitions.
Table 3. Dynamic system GMM non-zero countries.
Table 4. Total FDI and growth, comparative view.
Table 5. FDI by sectors and growth, comparative view.
Table 6. FDI by technology and growth, comparative view.
Table A1. List of countries.
Table B1. Summary statistics.
Table B2. Correlation table (full correlation data – inclusive of control variables).
Table B3. Variance inflation factor.
Table B4. Panel unit root test results.
Table B5. Fixed effects in non-zero countries.
Table B6. Dynamic system GMM full sample.
Table B7. Dynamic system GMM high-income countries.
Table B8. Fixed effects (full sample).
Table B9. Fixed effects high-income countries.
Table B10. Secondary sector FDI classified by technology-dynamic system GMM (non-zero countries).