
Figures & data
Figure 1. Classification of municipalities.
Classification of municipalities for the analysis as bible belt (SGP voter share 4%), outside bible belt (SGP voter share0.5%), and dropped (SGP voter share between 0.5% and 4%, or classification according to the SGP voter share is not stable in the observation period).
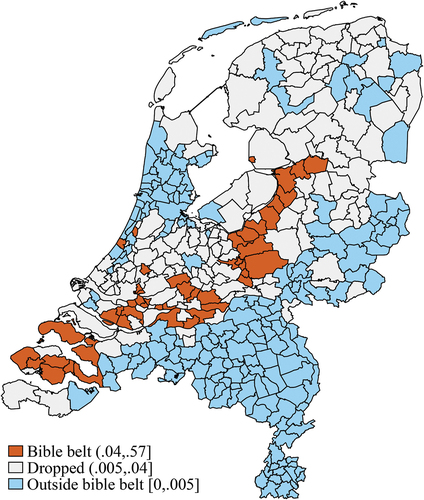
Figure 2. Average labour market outcomes inside and outside the bible belt before and after having children.
Yearly average earnings and participation for first-time parent cohorts 2008–2013, and yearly average FTE and the wage rate for parent cohorts 2008–2012.
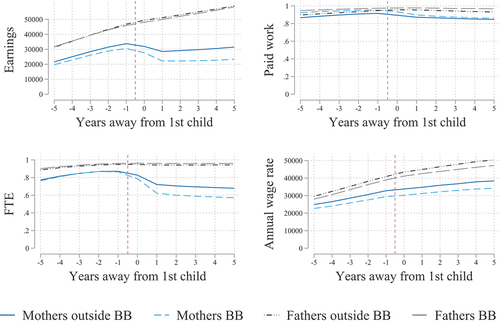
Figure 3. Child penalties (CP) inside and outside the bible belt.
Child penalties (CP) with 95% confidence intervals by event time for parents inside and outside the bible belt (BB), where measures the % change in the outcome due to the child compared to the pre-birth trend (see EquationEquation 3(3) (3) ). Four labour market outcomes are depicted: unconditional earnings, the probability of having any paid work, full-time equivalent (FTE), and annual wage rate. Solid lines refer to women, men are represented with dashed lines.
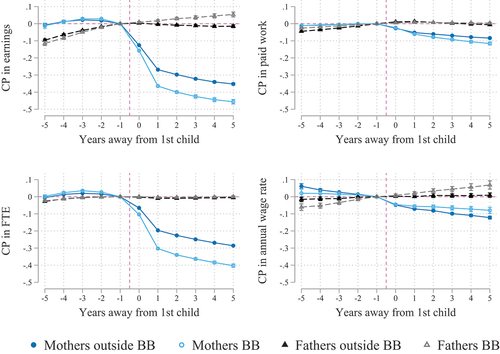
Table 1. Differences in child penalties (in percentage points) between parents inside and outside the bible belt by event time (5 years before to 5 years after the first child).
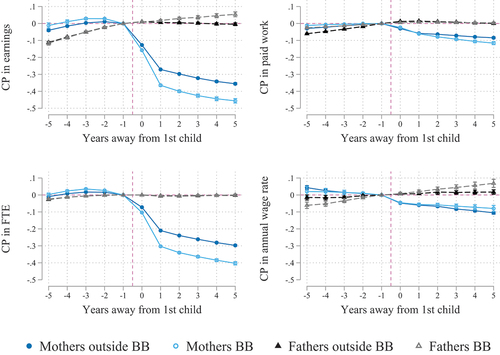
Figure 4. Child penalties (CP) inside and outside the bible belt: CEM weighted.
Weighted child penalties (CP) with 95% confidence intervals by event time for parents inside and outside the bible belt (BB), where measures the % change in the outcome due to the child compared to the pre-birth trend (see EquationEquation 3(3) (3) ). Four labour market outcomes are depicted: unconditional earnings, the probability of having any paid work, full-time equivalent (FTE), and annual wage rate. Solid lines refer to women, men are represented with dashed lines.
Supplemental material