
Figures & data
Table 1. Descriptive statistics on patient characteristics and hospitals attributes.
Table 2. Parameter estimates from the mixed Logit model, and of the bound estimator.
Table 3. Expected distribution of hospital characteristics, based on the predicted probabilities of patient referral and predicted patient choice.
Figure B1. Distance patients – hospitals distribution fitted in the raw dataset, before restricting the sample to hospitals within 160 kilometres of the patients’ places of residence.
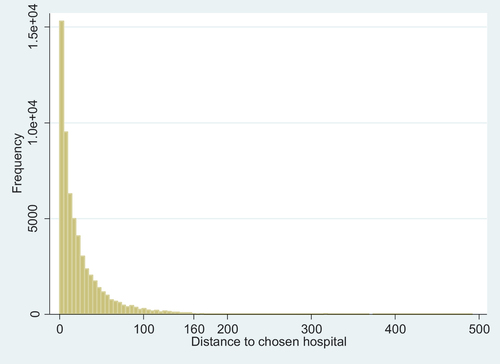
Table C1. Share of patients (%) having at least h hospitals available within a radius of k kilometres.
Figure C1. Cumulative density of patient geographical availabilities of providers.
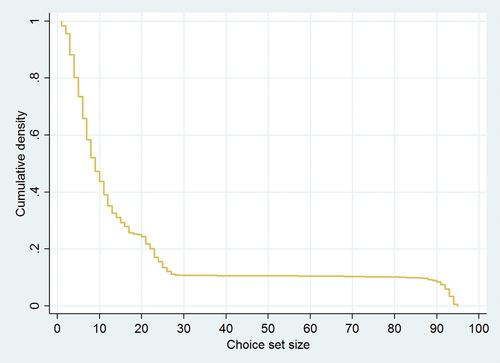
Figure C2. Histogram of patient geographical availability of providers.
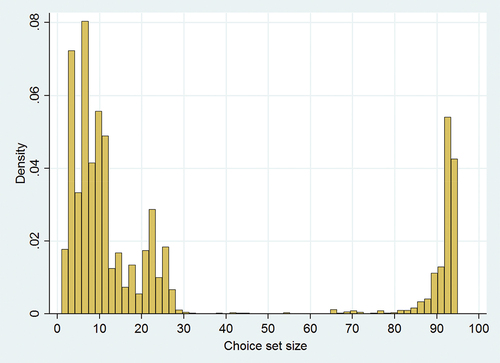
Table C2. Share of patients (%) choosing the ith nearest hospital.
Figure C3. Histogram of the lower bound (i.e. hospitals chosen by other patients living within a radius of 15 kilometres) of the patient choice set size in our identification strategy.
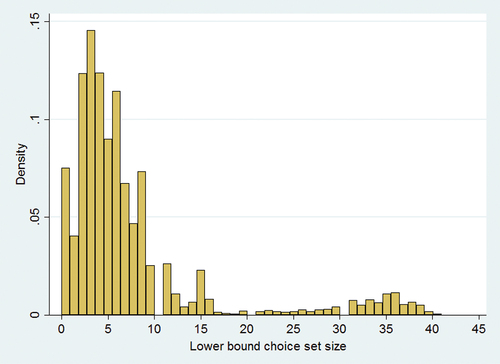
Figure C4. Share of patients excluded from the lower bound according to the radius chosen for the lower bound.
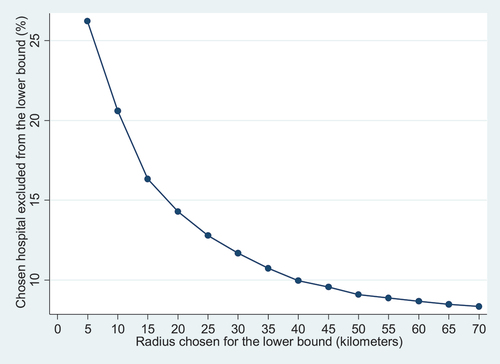
Table C3. Average size of the lower bound choice set according to the radius chosen.
Table D1. Descriptive statistics on hospital attributes in the full sample without missing data (i.e. excluding the parameters for the patients’ room rate) and in the restricted sample.
Figure E1. Distribution of patients-hospitals distances.
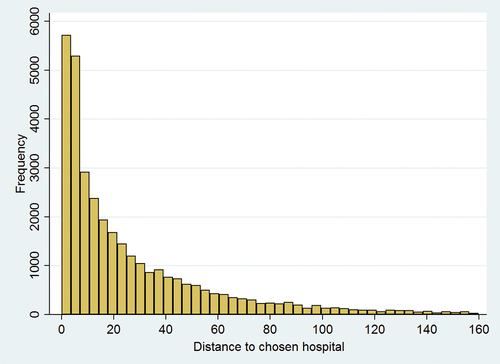
Table F1. Parameter estimates from the mixed Logit model in the full sample without missing data, thus excluding the parameters on patients’ room rate.
