
Figures & data
Table 1. Number of selected works and descriptive statistics of the partial correlation coefficients, t-test, and Shapiro–Wilk normality test of collected estimates and univariate comparative analysis of three study types.
Figure 1. Kernel density estimation of collected estimates.
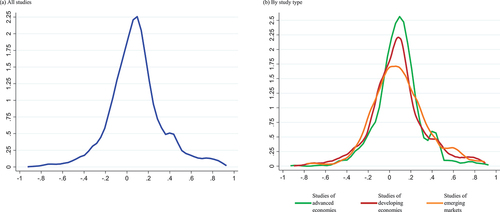
Table 2. Synthesis of collected estimates.
Figure 2. Funnel plot of partial correlation coefficients.
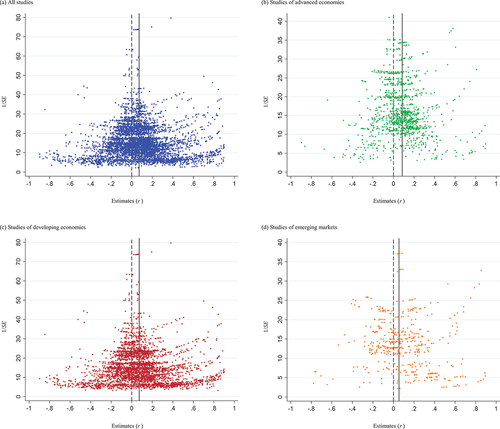
Table 3. Univariate test of publication selection bias.
Table 4. Meta-regression analysis of publication selection: all studies.
Table 5. Alternative estimates of publication selection bias-corrected effect size: all studies.
Table 6. Summary of publication selection bias test.
Table 7. Meta-regression analysis with selected moderators.
Table A1. Names, definitions, and descriptive statistics of meta-independent variables.
Table A2. Meta-regression analysis of model uncertainty and multicollinearity for the selection of moderators.
Table A3. Meta-regression analysis with all moderators.