Figures & data
Figure 1. Indicative trend of energy consumption for space heating by increasing the number of storeys. Adapted from Rode et al. (Citation2014).
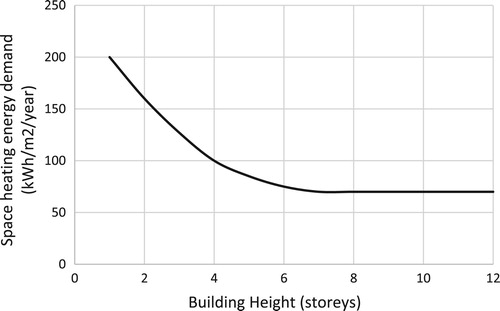
Figure 2. Relative energy use compared to building height for the original research (Figure ) and recalculated to include upgraded insulation standards and energy use in common areas.
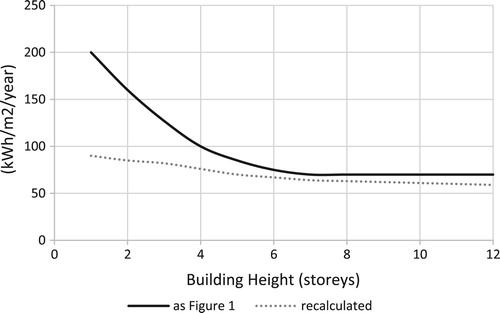
Figure 3. Relative energy consumption in different building types (empirical results from Sydney). Adapted from Myors, O’leary, and Helstroom (Citation2005).
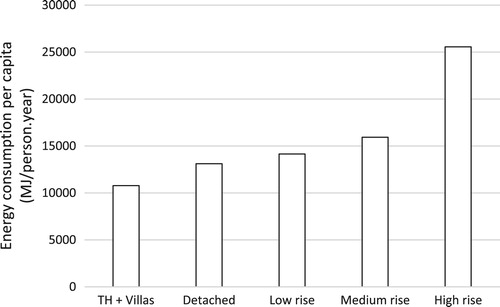
Figure 4. Average per capita energy use in different building types. Adapted from Heinonen and Junnila (Citation2014).
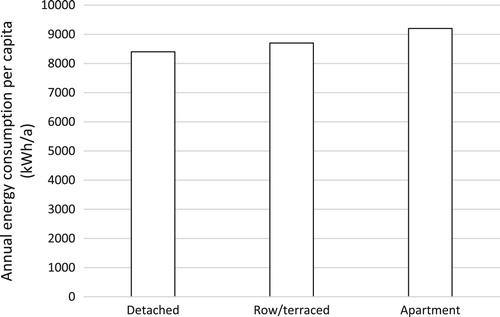
Figure 5. Comparing the potential energy generated from PVs with the energy consumed by the building. Adapted from Byrd et al. (Citation2013).
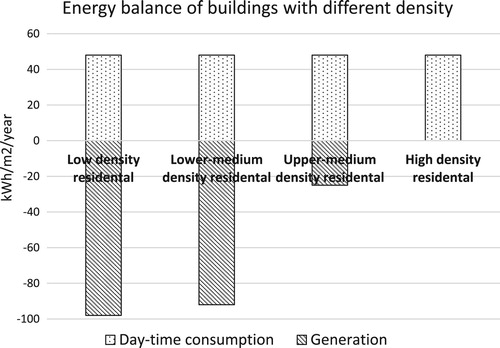
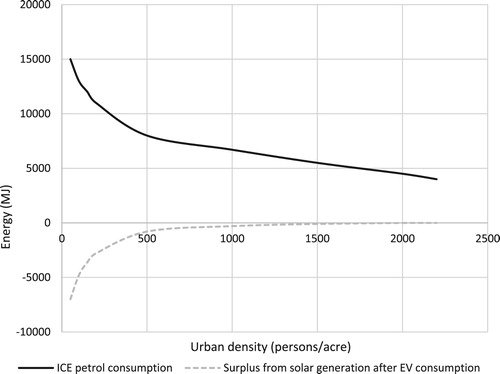
Figure 6. Gasoline use per capita versus population density. Adapted from Newman and Kenworthy (Citation1989a).
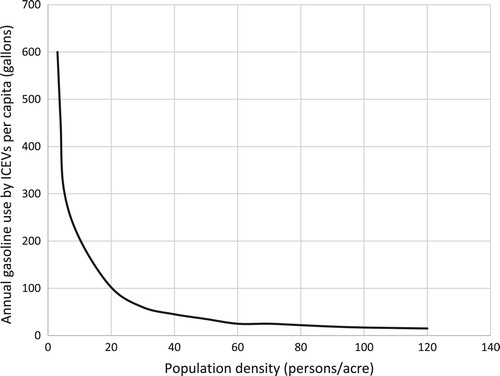
Figure 7. Comparison of transportation energy consumption in case of using ICVEs and EVs. Adapted from Byrd et al. (Citation2013).