
Figures & data
Figure 1. Typical equipment set up in the classroom.
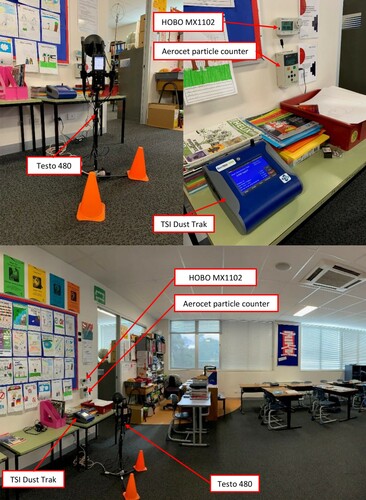
Table 1. Instrument specifications.
Table 2. School classroom characteristics.
Figure 2. Variations of air temperature in the school classrooms for four school terms during school hours (9:00am–3:30pm).
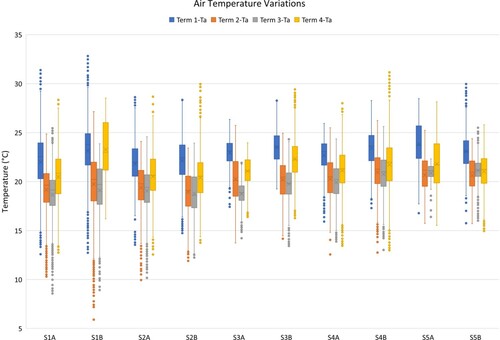
Figure 3. Variations of relative humidity in the school classrooms for four school terms during school hours (9:00am–3:30pm).
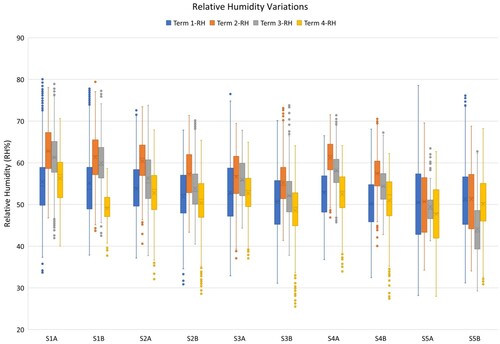
Figure 4. CO2 concentration levels in the school classrooms for four school terms during school hours (9:00am–3:30pm).
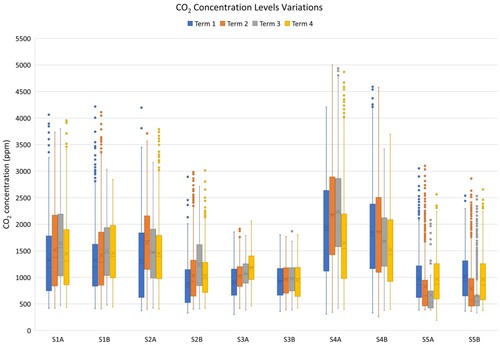
Figure 5. Hourly average CO2 concentration levels for S3B.
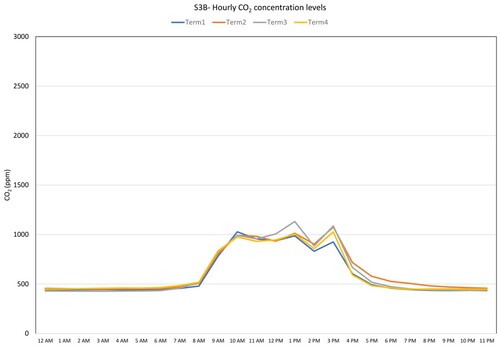
Figure 6. Hourly average CO2 concentration levels for S4A.
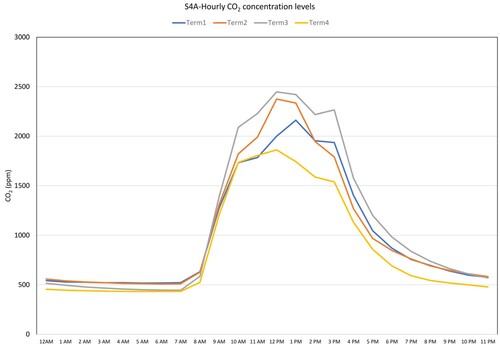
Table 3. Calculated air change rates.
Table 4. Calculated ventilation rate values per student.
Figure 7. PM10 levels in the schools during four school terms.
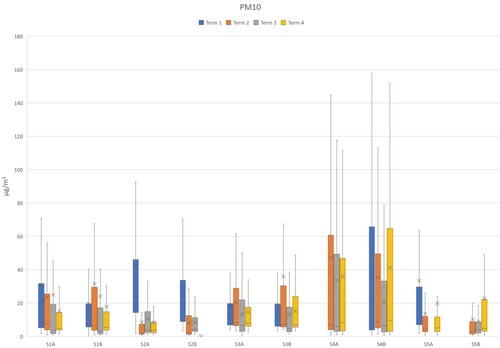
Figure 8. PM2.5 levels in the schools during four school terms.
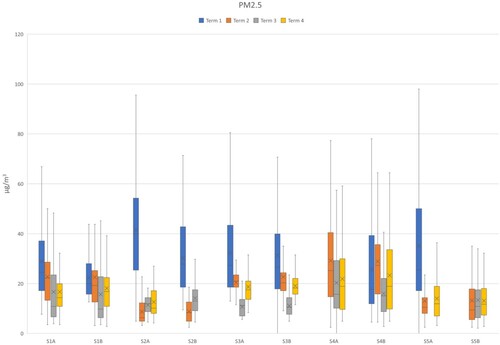
Figure 9. PM10 indoor–outdoor ratio.
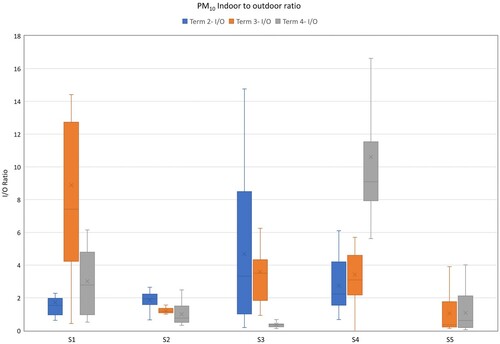
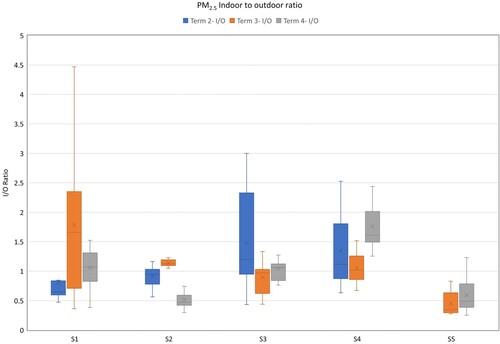
Figure 10. PM2.5 indoor–outdoor ratio.
Supplemental Material
Download MS Word (747.3 KB)Data availability
All data generated or analysed during this study are included in this article (and its supplementary information files).