Figures & data
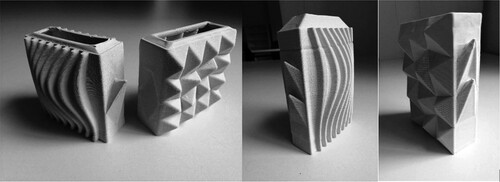
Figure 1. (A) First geometry design iteration test with high level of complexity where distortion occurs during printing (B) Simple geometries with fewer polygon faces that display a higher level of fidelity in relation to the digital model.
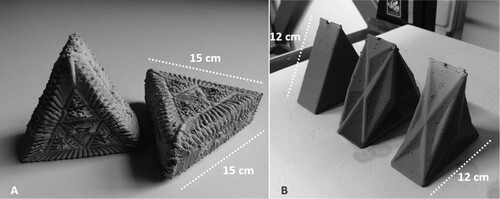
Table 1. Geometry variations as design in software, sowing values prior to kiln firing that resulted in 20% shrinkage.
Figure 2. Clay 3D printing of (A) four, (B) one and (C) two wall ceramic vessels that have the same outer dimensions and variable inner volume.
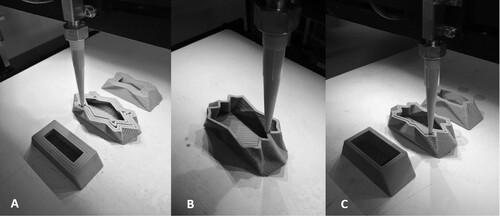
Figure 3. (A) 0% infill, (B) 15% rectilinear infill, (C) 15% aligned rectilinear infill, (D) 25% rectilinear infill, (E) 25% aligned rectilinear infill.
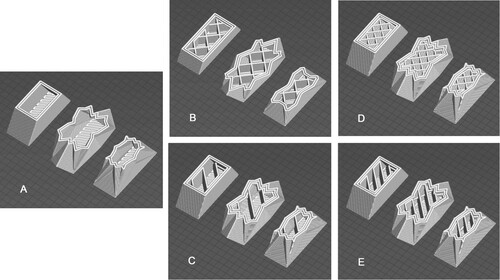
Figure 4. (A) Porcelain, (B) White Fleck, (C) ES65.
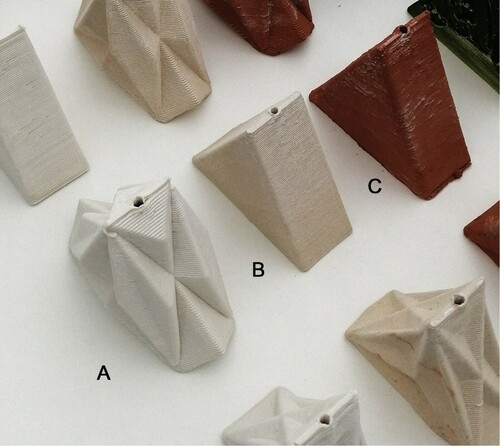
Figure 5. (A) Algae Auro binder and kappa carrageenan matrix being applied to an inset sample using a brush, (B) Algae kappa carrageenan matrix coated ceramic samples.
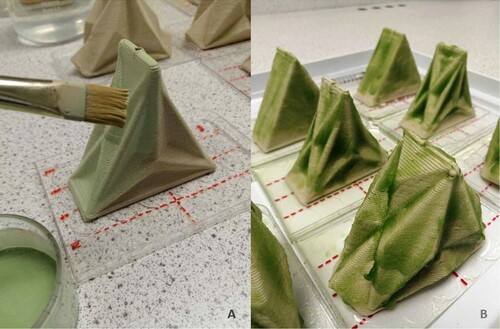
Figure 6. (Left) Algae Auro binder matrix 1 Wall Day 0, imaged using I-PAM (Right) Same sample and imaging method Day 14 showing increase in cells and cell migration to the well-plate. Black indicates an absence of photosynthetic cells, whilst greens and blues indicate highest amount of chlorophyll fluorescence. [See Colour Online].
![Figure 6. (Left) Algae Auro binder matrix 1 Wall Day 0, imaged using I-PAM (Right) Same sample and imaging method Day 14 showing increase in cells and cell migration to the well-plate. Black indicates an absence of photosynthetic cells, whilst greens and blues indicate highest amount of chlorophyll fluorescence. [See Colour Online].](/cms/asset/734f7ca2-15b9-4c65-a114-540cecbe3a7d/tasr_a_2058908_f0006_oc.jpg)
Figure 7. SEM images of (Left) stoneware ceramic fired at 1000°C (Right) stoneware ceramic fired at 1200°C.
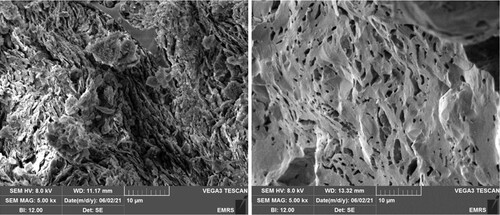
Figure 8. Fluorescence yield (n = 3, mean ± 0.027 StDev) of algae grown over 14 days while immobilized within kappa carrageenan on single walled vessels fired at 1000 and 1200°C compared with suspension and gel controls.
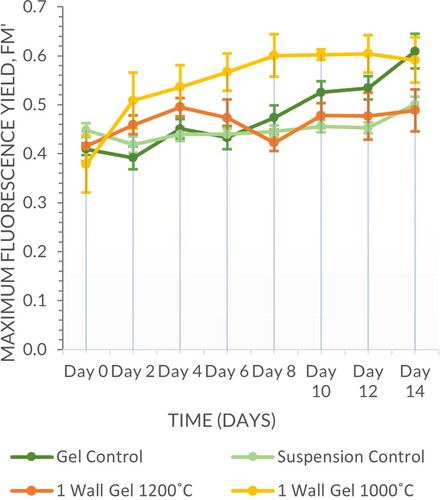
Figure 9. Fluorescence yield (n = 3, mean ± 0.060 StDev) of algae grown over 14 days while immobilized within kappa carrageenan on multiwalled vessels fired at 1000°C compared with the single walled vessels.
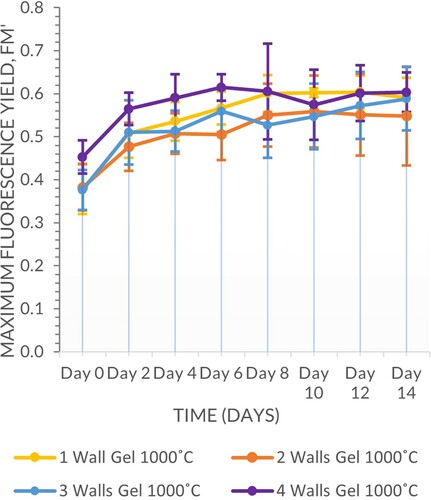
Figure 10. Fluorescence yield (n = 3, mean ± 0.036 StDev) of algae grown over 14 days while immobilized within Auro 331 on single walled vessels fired at 1000 and 1200°C compared with suspension and gel controls.
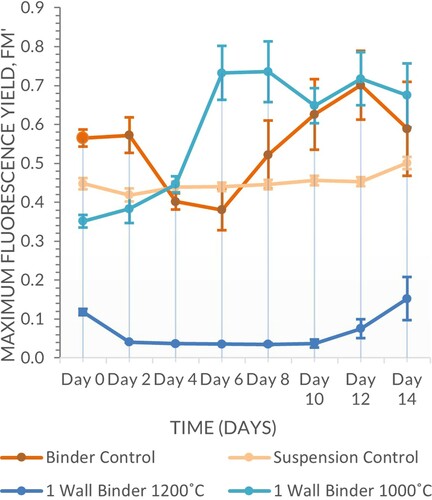
Figure 11. Fluorescence yield (n = 3, mean ± 0.060 StDev) of algae grown over 14 days while immobilized within Auro 331 on multi-walled vessels fired at 1000°C compared with the single walled vessels.
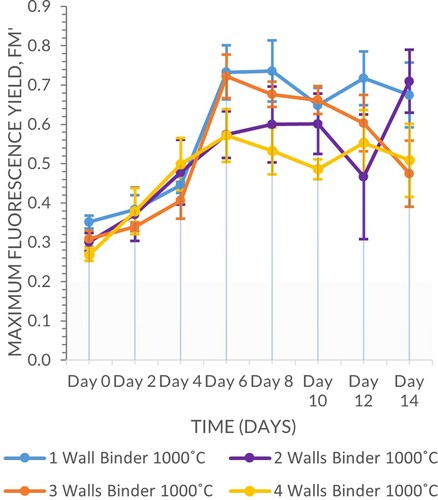
Figure 12. Fluorescence yield (n = 3, mean ± 0.041 StDev) of algae grown over 14 days while immobilized within kappa carrageenan on multi-internal subdivision double walled vessels fired at 1000°C.
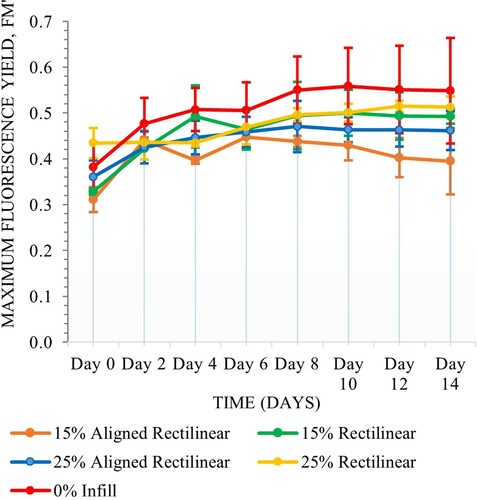
Figure 13. Fluorescence yield (n = 3, mean ± 0.067 StDev) of algae grown over 14 days while immobilized within Auro 331 on multi-internal subdivision double walled vessels fired at 1000°C.
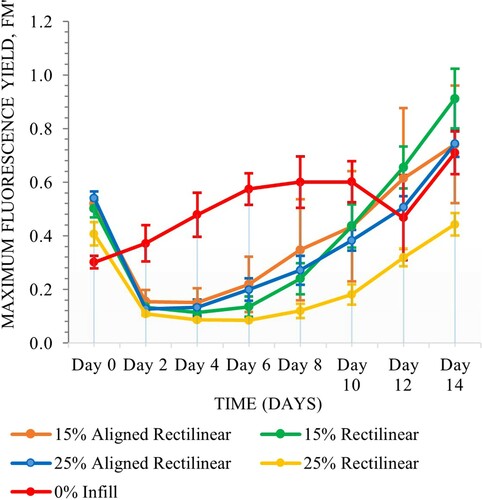
Figure 14. Fluorescence yield (n = 3, mean ± 0.050 StDev) of algae grown over 14 days while immobilized within Auro 331on multiple clay type, double walled vessels fired at 1000°C.
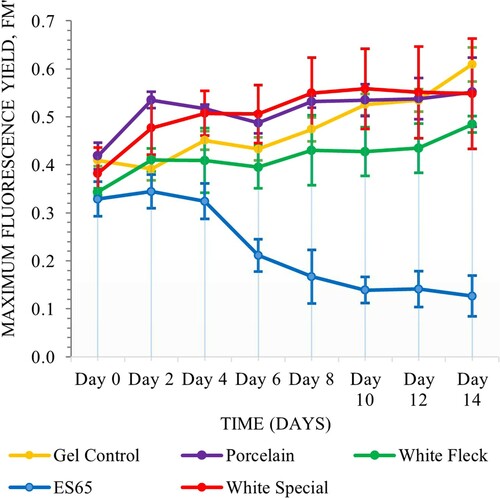
Figure 15. Fluorescence yield (n = 3, mean ± 0.055 StDev) of algae grown over 14 days while immobilized within Auro 331on multiple clay type, double walled vessels fired at 1000°C.
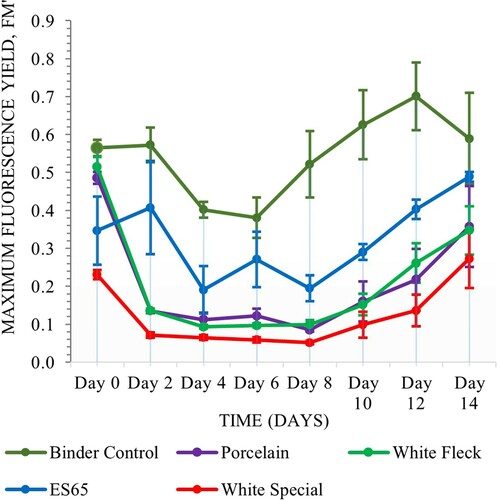
Figure 16. Photograph and I-PAM of 2 Wall sample fired at 1000°C with Auro binder (A) day 0 (B) day 14. The images demonstrate how the matrix visibly acquires a darker green colour indicating higher cell density whilst the I-PAM images demonstrate lighter areas in outward folds except for top edge which offers a flat surface.
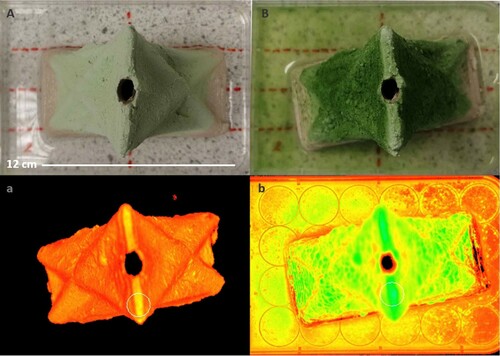
Figure 17. 3D printed ceramic, interlocking hollow building block designs that feature an increased surface area and a large internal nutrient storage capacity. The designs present interlocking and reconfigurable units that add a level of flexibility within the building fabric. Work by Assia Crawford.