Figures & data
Figure 1. Illustration of the two types of expansion location in the apartment – a view from above the presented apartment models*. Left panel: the expansion is located at the entrance and so the apartment narrowed in space towards the edge of the apartment space. Right panel: the expansion is located at the edge of the apartment space and so the apartment widened in space towards the edge of the apartment space. In both illustrations The figure presents the simulated measures of the apartment space. The red dot indicates the location in which the simulated movement within the apartment began, and the orange arrows demonstrate the trajectory of simulated movement in the apartment models. *This illustration does not depict the image presented as stimuli to subjects.
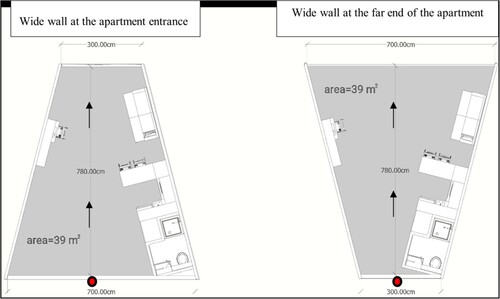
Figure 2. Video clip depictions of the experimental design – depicts the kitchen, dining area, and sofa on the right hand side and a desk on the left (half the models presented a mirrored interior setup).
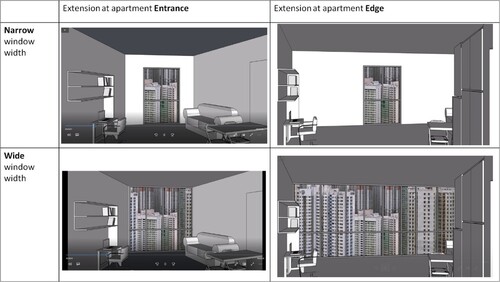
Figure 3. Simulated Window Sizes in each condition – the width of the windows is equal for the Narrow window size conditions (top row), but the width of the windows is different for the Wide window conditions (bottom row).
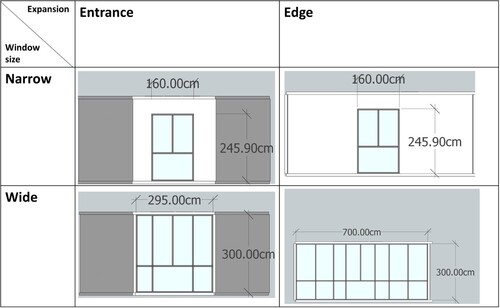
Figure 4. Trial sequence – (left to right) fixation cross (1 second), static image of apartment entrance facing towards the apartment interior (2 seconds), dynamic depiction of movement progressing in a straight line towards the edge of the apartment (7 seconds), and a static view at the edge of the apartment, out the window (2 seconds).
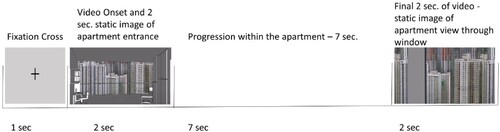
Figure 5. Group average density ratings – a main effect of both expansion location (Entrance versus Edge) [F(1,30) = 21.392, P = .000, ηρ2 = .416], and Window size (Wide versus Narrow) [F(1,30) = 11.267, P = .002, ηρ2 = .273] (brackets depict main effects). There was also a significant interaction between window size and expansion location [F(1,30) = 6.532, P = .016, ηρ2 = .179]. Error bars – standard errors. Braces – main effect. *P < .05, **P < .01, ***P < .001.
![Figure 5. Group average density ratings – a main effect of both expansion location (Entrance versus Edge) [F(1,30) = 21.392, P = .000, ηρ2 = .416], and Window size (Wide versus Narrow) [F(1,30) = 11.267, P = .002, ηρ2 = .273] (brackets depict main effects). There was also a significant interaction between window size and expansion location [F(1,30) = 6.532, P = .016, ηρ2 = .179]. Error bars – standard errors. Braces – main effect. *P < .05, **P < .01, ***P < .001.](/cms/asset/a9cd23f0-eb56-4760-ba80-9ebf3cc92022/tasr_a_2224284_f0005_oc.jpg)
Figure 6. Group average positive affect ratings. – a significant main effect of Window size (Wide versus Narrow) [F(1,30) = 25.330, P = .000, ηρ2 = .458] (brackets depict main effects), and a significant interaction between window size and expansion location [F(1,30) = 4.720, P = .038, ηρ2 = .136]. Error bars – standard errors. Braces – main effect. *P < .05, **P < .01, ***P < .001.
![Figure 6. Group average positive affect ratings. – a significant main effect of Window size (Wide versus Narrow) [F(1,30) = 25.330, P = .000, ηρ2 = .458] (brackets depict main effects), and a significant interaction between window size and expansion location [F(1,30) = 4.720, P = .038, ηρ2 = .136]. Error bars – standard errors. Braces – main effect. *P < .05, **P < .01, ***P < .001.](/cms/asset/34c31ea5-1965-4d12-9573-3fdb35d1e5ac/tasr_a_2224284_f0006_oc.jpg)
Figure 7. Right primary sensory (rPS) Cluster – (A) Cluster mean DIPFIT dipole location, (B) fMRI presentation of mean DIPFIT dipole location, (C) Cluster mean power spectrum, 10 × log10 (_V2/Hz)), for each condition, (D) topographic scalp map of the cluster.
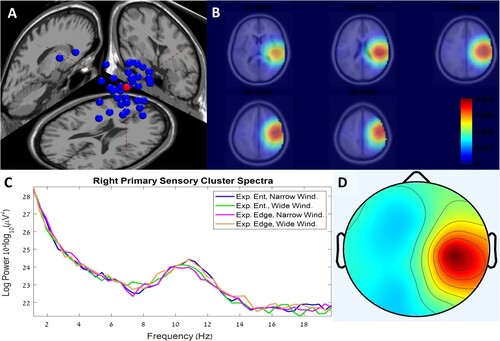
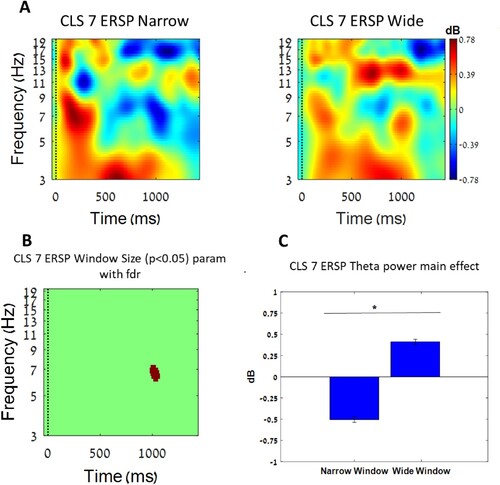
Figure 8. Right primary sensory (rPS) Cluster independent component (IC) illustration – illustration of activities in right primary sensory (rPM) cluster (panels a, b, and c). (a) event-related spectral perturbation (ERSP) for rPS cluster respectfully. Columns of the figure from left to right present each of the four conditions: Expansion at Entrance and Narrow Window, Expansion at Entrance and Wide Window, Expansion at Edge and Narrow Window, and Expansion at Edge and Wide Window. In (b) pixels highlighted in red showed statistical differences across levels of Expansion Location and Window Size (p < 0.05 FDR corrected). In (c) the mean values of the highlighted pixels indicated by the arrow. Error bars are for SE.
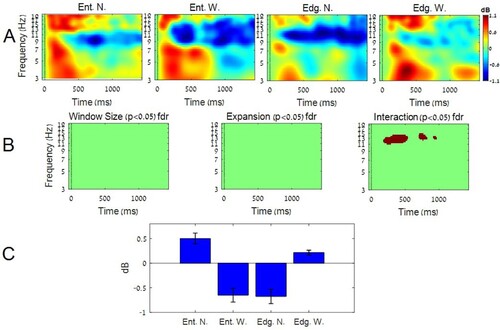
Figure 9. Left primary sensory (lePS) Cluster – (A) Cluster mean DIPFIT dipole location, (B) fMRI presentation of mean DIPFIT dipole location, (C) Cluster mean power spectrum, 10 × log10 (_V2/Hz)), for each condition, (D) topographic scalp map of the cluster.
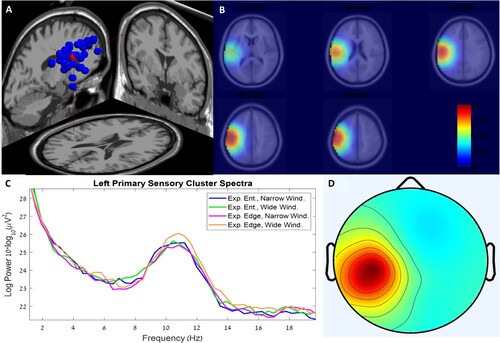
Figure 10. Left primary sensory (lePS) Cluster IC illustration – illustration of activities in left primary sensory (lePM) cluster (panels a, b, and c). (a) event-related spectral perturbation (ERSP) for lePS cluster respectfully. Columns of the figure from left to right present each of the two conditions: Narrow Window and Wide Window. In (b) pixels that are highlighted in red showed statistical differences across levels of Window Size (p < 0.05 FDR corrected). In (c) the mean values of the highlighted pixels in B. Error bars are for SE.