
Figures & data
Table 1. Benefits of VEs recognised by existing literature.
Table 2. Existing Classification of VEs.
Figure 1. Research methodology.
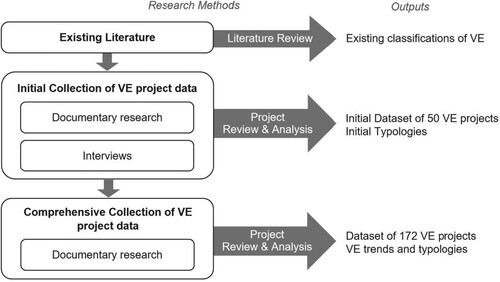
Table 3. Project inclusion and exclusion criteria.
Figure 2. Project locations by region.
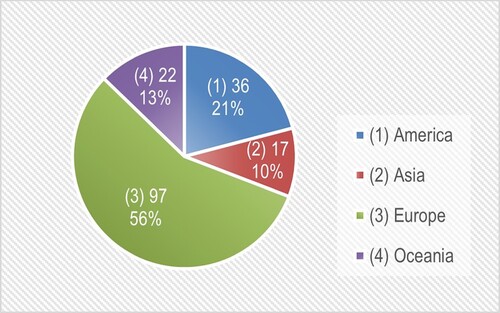
Figure 3. Project locations by country
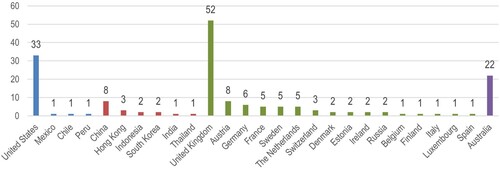
Figure 4. Construction periods of: a. base buildings (left); b. VEs (right). Note: There are 180 base buildings and 172 VEs, because in 7 projects, VEs were built atop 2–3 base buildings.
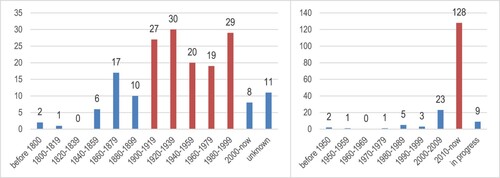
Figure 5. Construction time gaps between base buildings and VEs.
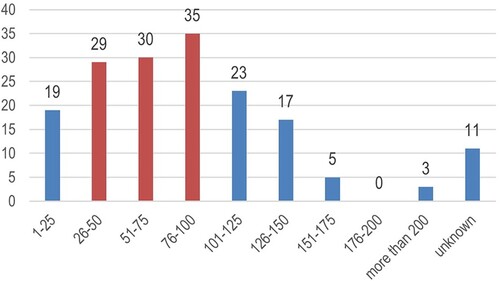
Figure 6. The number of storeys of base buildings and VEs.
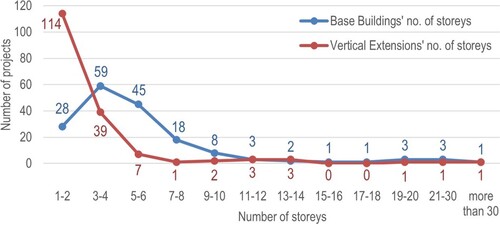
Figure 7. Percentages of storeys added.
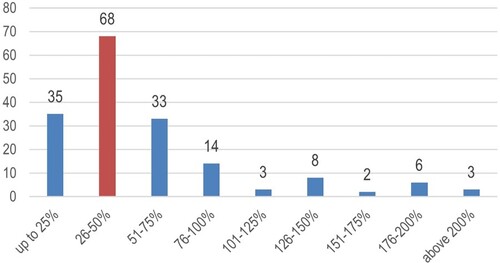
Figure 8. The functional classification used and its references.
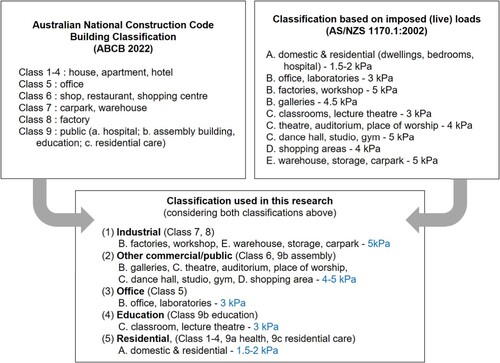
Figure 9. Functions of: a. base buildings (left); b. VEs (right). Note: There are 180 base buildings and 172 VEs, because in 7 projects, VEs were built atop 2–3 base buildings.
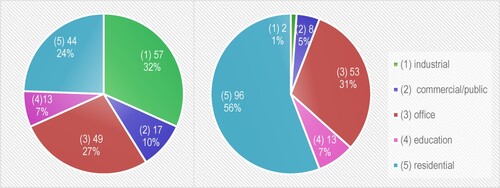
Figure 10. Functional changes of base buildings and VEs’ functions. Note: Each node shows ‘[building function]: [no. of buildings]’. In this diagram, the number of buildings considered has been adjusted. Where multiple base buildings were located beneath a VE, these have been counted as a single building to ensure consistency in the Sankey diagram, except if they had different functions, resulting a total of 173 buildings in the graph.
![Figure 10. Functional changes of base buildings and VEs’ functions. Note: Each node shows ‘[building function]: [no. of buildings]’. In this diagram, the number of buildings considered has been adjusted. Where multiple base buildings were located beneath a VE, these have been counted as a single building to ensure consistency in the Sankey diagram, except if they had different functions, resulting a total of 173 buildings in the graph.](/cms/asset/9efd2bcb-82b3-497b-ac48-6119dd359015/tasr_a_2240289_f0010_oc.jpg)
Figure 11. Five forms of VEs identified along with examples of projects: (1) extruded – Adina Apartment Hotel, Melbourne; (2) setback – Deco Building, Sydney; (3) roof – Trikafabriken 9, Hammarby Sjostad; (4) rooftop village – Didden Village, Rotterdam; (5) freeform – Substation 164, Sydney [images courtesy of: (1) © Peter Clarke; (2) © Brett Boardman; (3) © Felix Gerlach for Tengbom; (4) © Rob t Hart for MVRDV; (5) © author] .
![Figure 11. Five forms of VEs identified along with examples of projects: (1) extruded – Adina Apartment Hotel, Melbourne; (2) setback – Deco Building, Sydney; (3) roof – Trikafabriken 9, Hammarby Sjostad; (4) rooftop village – Didden Village, Rotterdam; (5) freeform – Substation 164, Sydney [images courtesy of: (1) © Peter Clarke; (2) © Brett Boardman; (3) © Felix Gerlach for Tengbom; (4) © Rob t Hart for MVRDV; (5) © author] .](/cms/asset/4afa6609-4cc2-44a2-b9f9-e95c9001d02a/tasr_a_2240289_f0011_oc.jpg)
Figure 12. Project classification based on forms of VEs. Note: Combination of two forms was applied in 11 out of 172 VE projects.
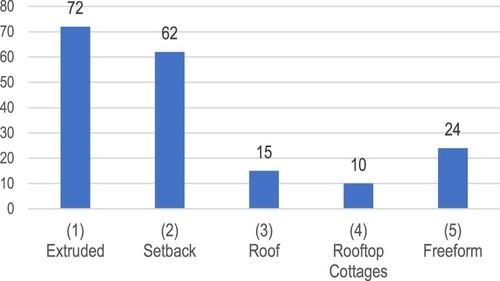
Figure 13. Examples of VE projects and their facade strategies: (1) unified facade at Blue Cross Blue Shield; Chicago; (2) similar facade at Midtown Centre, Brisbane; (3) distinct facade at De Karel Doorman; Rotterdam [images courtesy of: (1) © James Steinkamp Photography for Goettsch Partners; (2) © AM Brisbane CBD Investments & DMC Projects; (3) © Ibelings van Tilburg architecten, Ossip van Duivenbode] .
![Figure 13. Examples of VE projects and their facade strategies: (1) unified facade at Blue Cross Blue Shield; Chicago; (2) similar facade at Midtown Centre, Brisbane; (3) distinct facade at De Karel Doorman; Rotterdam [images courtesy of: (1) © James Steinkamp Photography for Goettsch Partners; (2) © AM Brisbane CBD Investments & DMC Projects; (3) © Ibelings van Tilburg architecten, Ossip van Duivenbode] .](/cms/asset/2c897e35-4d6e-4682-8070-2017caef399f/tasr_a_2240289_f0013_oc.jpg)
Figure 14. Project classification based on facade designs of VEs. Note: Combined facade designs were applied in 3 out of 172 VE projects.
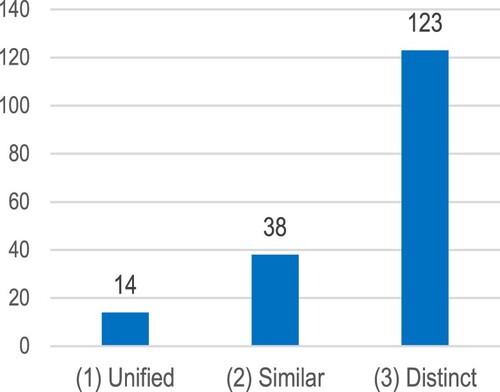
Figure 15. Project classification based on plan for VEs.
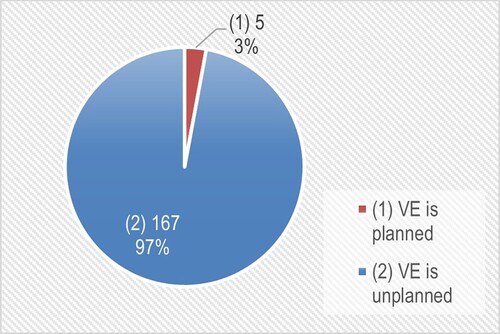
Figure 16. Three structural support strategies for VE (Julistiono, Oldfield, Cardellicchio Citation2023).
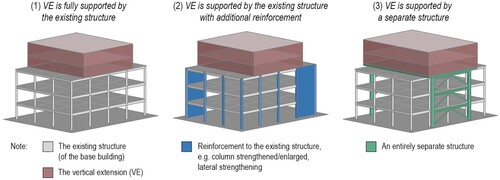
Figure 17. Project classification based on structural support strategies.
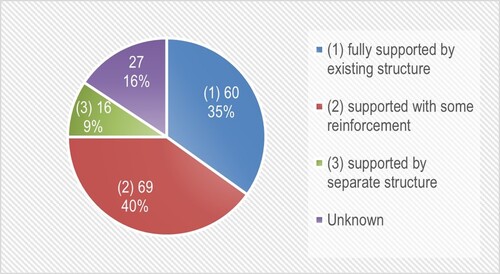
Figure 18. Project classifications based on: a. primary structural materials of base buildings (left); b. primary structural material of VEs (right).
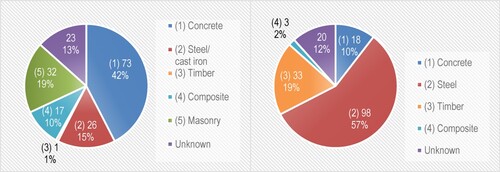
Figure 19. Project classification based on occupation conditions while VE is built.
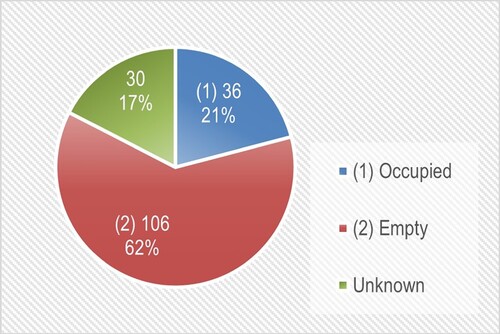
Figure 20. Summary of the most frequent trends and characteristics of VE development.
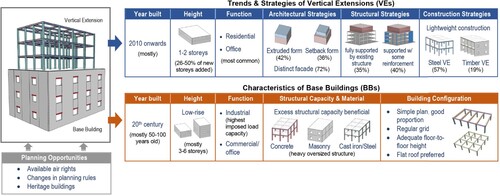
Table 4. Comparison of VE projects with three most frequent base building functions (industrial, office, residential).
Figure 21. Construction periods of steel VEs and timber VEs.
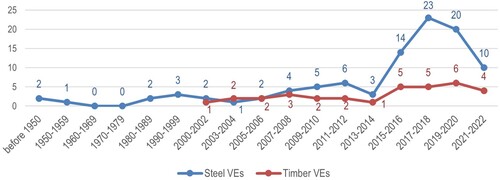
Table 5. Comparison of VE projects with steel and timber VEs.
Supplemental Material
Download PDF (823.1 KB)Data availability statement
The authors confirm that the data supporting the findings of this study are available within the article [and/or] its supplementary materials.