
Figures & data
Table 1. Gender and age split across countries.
Figure 1. Infographic with details on type of clients, their enquires and the building industry group participants work for.
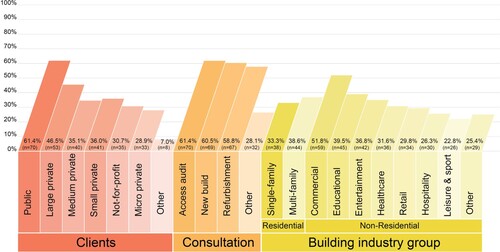
Table 2. Relationships between clients and buildings groups according to Fisher's Exact Test data analysis.
Figure 2. Factors that limit the uptake of Inclusive Design among architectural design practitioners.
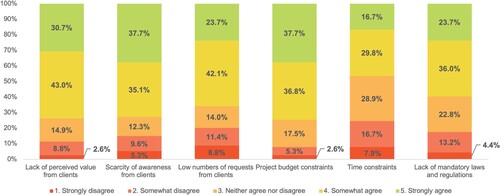
Figure 3. Importance of instruments to facilitate the development of knowledge of Inclusive Design among architectural design practitioners.

Figure 4. Four major components helpful in improving an Inclusive Design process for practitioners.
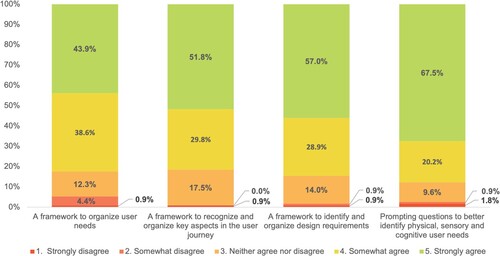
Figure 5. Components to consider for a POE tool targeting inclusion, diversity, equity and accessibility.
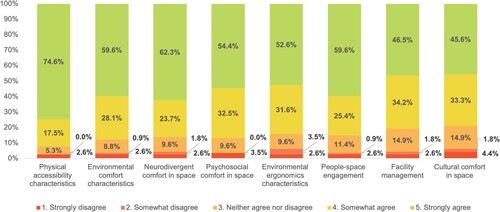
Figure 6. The components of the Inclusive Design Canvas.
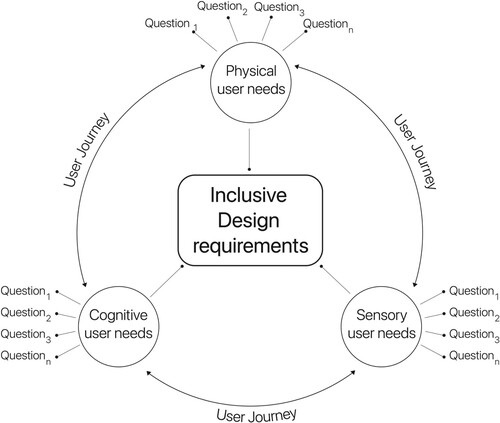
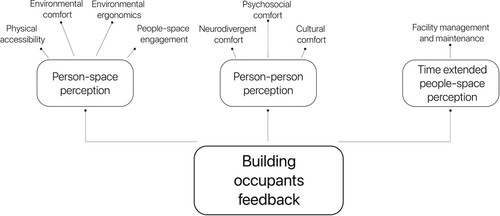
Figure 7. The components of the Inclusive Design Post-Occupancy Evaluation tool.
Data availability statement
The data that support the findings of this study are available from the corresponding author, MZ, upon reasonable request.