Figures & data
Table 1 Pandemics and probable pandemics of influenza, 1500–2000
Figure 1 Countries in which avian influenza A (H5N1) was reported in wild birds and poultry, December 2003 to May 2006. Shading categories identify World Organisation for Animal Health (OIE) member states in which outbreaks were first confirmed in the period 1 January–18 May 2006 (dark shading) and in prior time periods (light shading). Isochrones are modified from evidence presented by the Emergency Preparedness and Response Branch, U.N. World Food Programme, and show the approximate position of the panzootic wave front at six-month intervals. Vectors indicate the inferred corridors of panzootic diffusion. Summary details of the first reported outbreak(s) of H5N1 in OIE member states are given in the Appendix. Source: Based on information in Disease Information (Paris: OIE, 12 December 2003–18 May 2006).
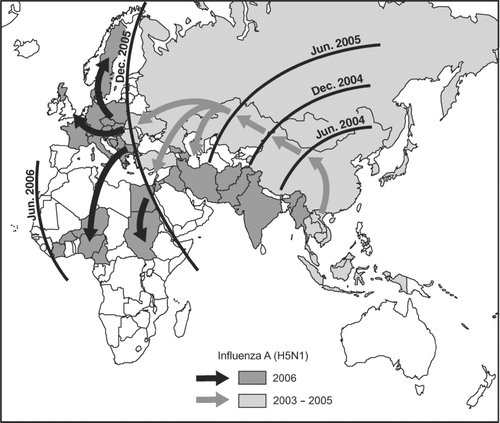
Table 2 Documented human infections with avian influenza A viruses, 1959–2005
Figure 2 Phases of global pandemic alert for influenza. The Global Influenza Preparedness Plan of the World Health Organization (WHO) identifies six phases of pandemic alert. Each phase of alert is associated with a series of recommended responses and activities to be implemented by WHO, the international community, governments, and industry. The epidemiological behavior of the disease and the characteristics of circulating viruses, among other factors, determine changes from one phase to another. Source: Based on information in CitationWHO (2005d).
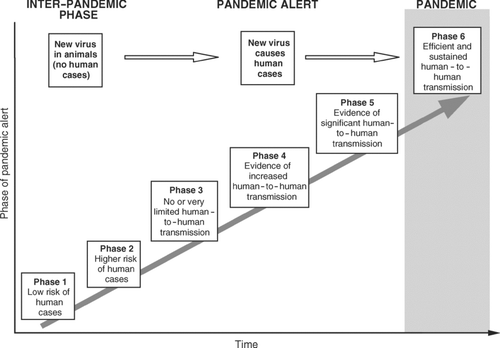
Figure 3 Global time series of outbreaks of avian influenza A (H5N1) in wild birds and poultry, January 2004–April 2006. The bar chart plots the global count of outbreaks, by month of report, to World Organisation for Animal Health. A polynomial regression line, fitted to the monthly series of reported outbreaks by ordinary least squares, is shown for reference. Source: Based on information in Disease Information (Paris: OIE, 12 December 2003–18 May 2006).
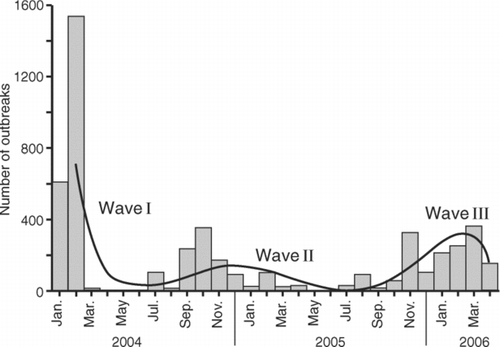
Figure 4 Wave I of the panzootic transmission of avian influenza A (H5N1). Proportional circles are based on information included in World Organisation for Animal Health's Disease Information and plot, by country, the count of reported outbreaks of H5N1 in wild birds and poultry in January (B) and February (C) 2004. The initial outbreaks in December 2003 are shown for reference (A). The date of report of the first outbreak of H5N1 in each affected country is given in parentheses.
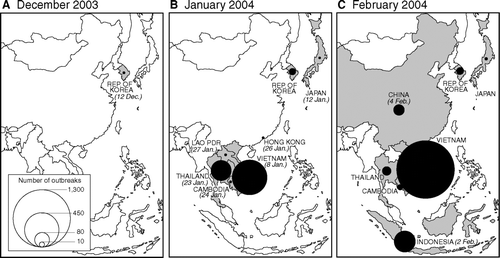
Figure 5 Waves II and III (part) of the panzootic transmission of avian influenza A (H5N1), July 2004–December 2005. Proportional circles are based on information included in World Organisation for Animal Health's Disease Information and plot, by country, the count of reported outbreaks of H5N1 in wild birds and poultry. (A) Wave II (July 2004–April 2005); (B) Wave III (part) (July–December 2005). Vectors for Wave III (B) plot the postulated routes of transmission of H5N1 from a primary focus of infection in east Asia, with the date of report of the first documented outbreak in a given country indicated (see Appendix). Infected countries are shaded.
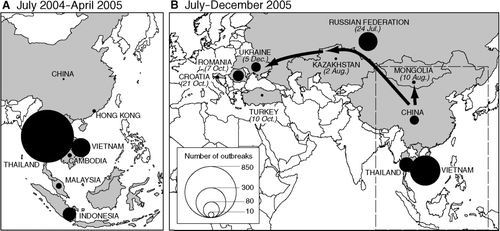
Table 3 Confirmed human cases of influenza A (H5N1), 2003–2006
Figure 6 Cross-correlation functions between weekly time series of avian outbreaks and human influenza cases due to H5N1, December 2003–May 2006. (A) Complete time series; (B) avian influenza Wave I (January–February 2004); (C) avian influenza Wave II (July 2004–April 2005); (D) avian influenza Wave III (July 2005–April 2006). The lag k associated with the maximum cross-correlation is indicated on each graph for reference.
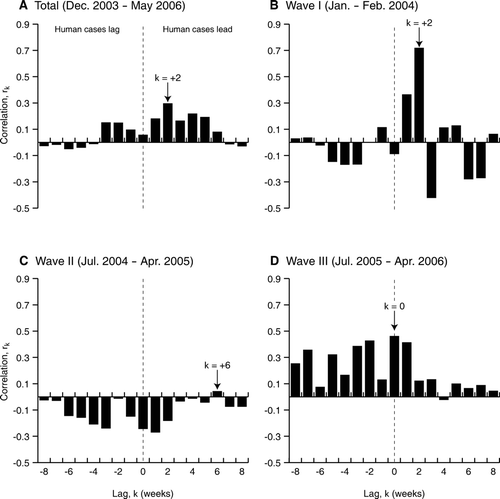
Figure 7 Geographical distribution of human cases of avian influenza A (H5N1) confirmed by the World Health Organization, December 2003–May 2006. Circles show the distribution of the 216 human cases reported to 18 May 2006. (A) December 2003–December 2004; (B) January-December 2005; (C) January–May 2006. Countries in which avian influenza A (H5N1) had been confirmed in wild birds, poultry, or both by the end of each time period are shaded. Isochrones are replotted from and show the approximate position of the panzootic wave front at six-month intervals.
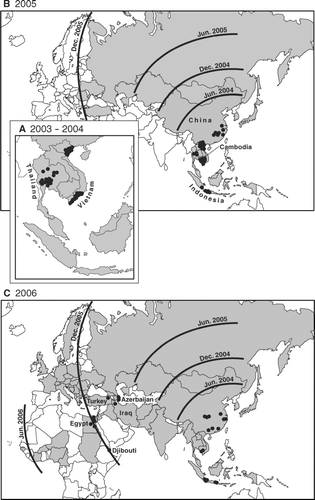
Figure 8 National time series of confirmed human cases of influenza A (H5N1) confirmed by the World Health Organization (WHO), December 2003–May 2006. The bar charts plot the number of confirmed human cases by week of report in WHO's Situation Updates—Avian Influenza. Countries are ordered according to the date of first report of cases (see Appendix). (A) Vietnam; (B) Thailand; (C) Cambodia; (D) Indonesia; (E) China; (F) other countries. Counts of human cases are given by country in . For reference, the line traces plot the national count of confirmed outbreaks of H5N1 in wild birds and poultry by week of report in the World Organisation for Animal Health's Disease Information.
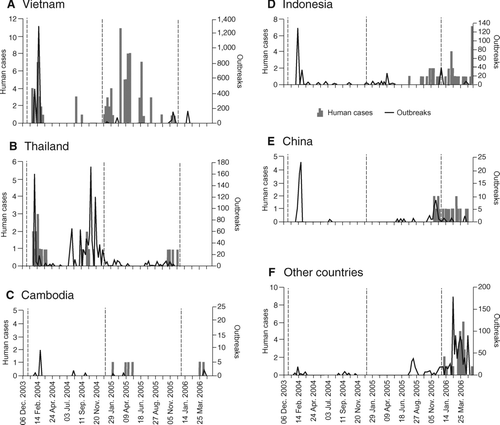
Figure 9 Age distribution of confirmed human cases of avian influenza A (H5N1), December 2003–May 2006. Box-and-whisker plots show the age distribution of cases by (A) gender, (B) year of report, (C) patient outcome, and (D) country. The horizontal line and bullet mark in each box give, respectively, the median and mean age of cases. The variability in age is shown by plotting, as the outer limits of the shaded box, the first and third quartiles, Q 1 and Q 3, of the ages. Whiskers encompass all ages that satisfy the criteria Q 1 − 1.5(Q 3 − Q 1) (lower limit) and Q 3 + 1.5(Q 3 − Q 1) (upper limit). Points beyond the whiskers denote outliers. Information in (C) is based on the recorded status of patients according to World Health Organization (WHO) sources, with the category “alive” formed to include patients who were last reported as hospitalized (alive) or discharged (recovered). The age band 30–35 years (diagonal shading) is marked on each graph for reference. Source: Redrawn from Smallman-Raynor and Cliff (2007, 511).
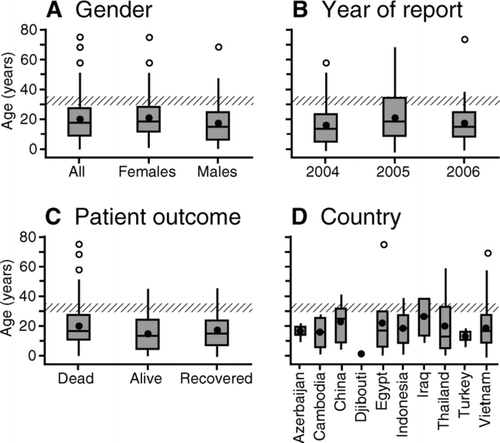
Figure 10 Seasonal distribution of avian influenza A (H5N1). Cobweb charts plot, as an average for each calendar month, the reported global occurrence of avian influenza A (H5N1), January 2004–May 2006. Monthly averages are expressed in standard normal (z) score form. Periods with above-average levels of disease activity (z > 0) are shaded. (A) Human cases confirmed by the World Health Organization; (B) avian outbreaks.
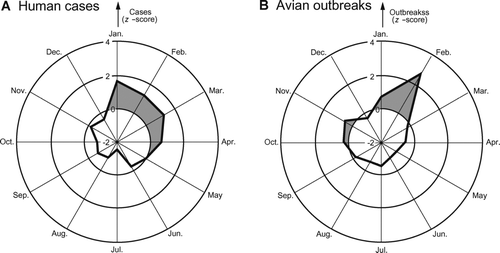
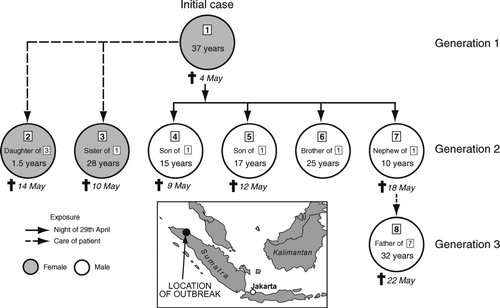
Figure 11 Extended family cluster of avian influenza A (H5N1) in the villages of Kubu Simbelang and Kabanjahe, North Sumatra, Indonesia, April–May 2006. Confirmed (n = 7) and probable (n = 1) cases are represented by circles (coded 1–8). The vectors indicate inferred routes of virus exposure. The age, date of death, and relationship of cases are indicated. The inset map gives the location of the cluster. Source: Based on information included in Situation Updates—Avian Influenza (Geneva: WHO, 18–23 May), after CitationButler (2006a).