
Figures & data
Figure 1. Soil water potential (SWP) variation under (a) T25, (b) T50 and (c) T75 treatments and (d) precipitation in 2010 and 2011. SWP data gaps in (a), (b) and (c) are due to data lost. Dashed lines in (a), (b) and (c) represent the target thresholds of −25, −50 and −75 kPa, respectively. Due to equipment failure, a large amount of precipitation was not recorded in August 2011
Figure 2. Soil water content (SWC) dynamics at 100 and 120 cm depths under different SWP treatments in 2011. The short solid bars represent irrigation events and the long bar indicates a rainfall of 83 mm
Figure 3. Dynamics of groundwater level from August 2009 to October 2012. Dashed lines indicate the depth of 100, 200, 300 and 400 cm
Table 1. Monthly precipitation and reference crop potential evapotranspiration (ET0) in the experiment site from April to October 2008–2011
Figure 4. Mean daily transpiration of Populus tomentosa on a ground area basis (E) under different treatments in 2010
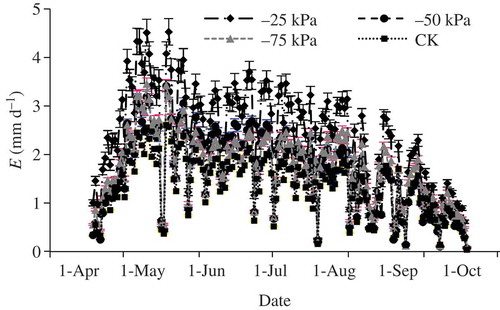
Figure 5. Monthly basal area at breast height (ABH) increments of P. tomentosa under different treatments in 2010 and 2011. Data are means of randomly selected trees within each treatment
Table 2. Adjusted mean increments of above-ground dry biomass (ADB) per hectare in different treatments in 2010 and 2011