
Figures & data
Table 1. Summary of maximum, minimum and average daily sap flow per tree and sap flow standardised to tree area for Albizia coriaria and Cordia africana over a 10-month period of the experiment
Figure 1. Daily average sap flow in Albizia coriaria and Cordia africana over a 10-month period. Rainfall events indicate the early wet season (April–June) and the start of the late wet season (August–November)
Figure 2. Radial changing of sap velocity in Albizia coriaria registered by the inner and outer thermocouples (data presented are average values from the three trees)
Table 2. Pearson’s correlation coefficients between rainfall and seasonal daily sap flow in Cordia africana and Albizia coriaria
Table 3. A two-way ANOVA to assess the interaction between tree species and season on daily sap flow
Figure 3. Key agroforestry systems and phenological events in Mt Elgon region of Uganda, indicated in terms of 2016 rainfall for the region
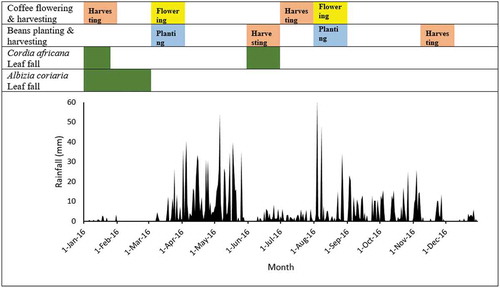
Table 4. Tree water use and tree parameters including method used for different tree species