
Figures & data
Table 1. Alignment parameters set for processing the photographs acquired by the DJI Phantom 4 Pro for the survey over a planted stand of young Eucalyptus pellita
Figure 1. Individual tree heights annotated onto an orthophoto derived using a digital surface model (DSM). High points in the DSM are closely aligned with the image of each tree top
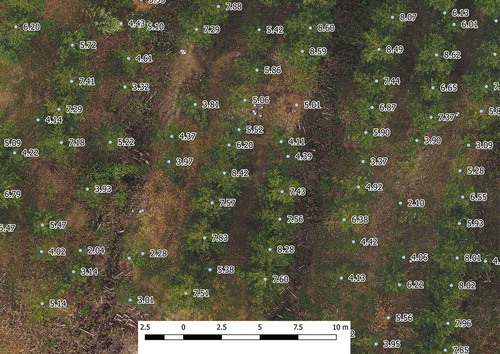
Figure 2. Illustration of settings used in the (a) Agisoft photoscan set raster transform function and (b) raster transform palette settings used for VARI VI VARI, visible atmospheric resistant index
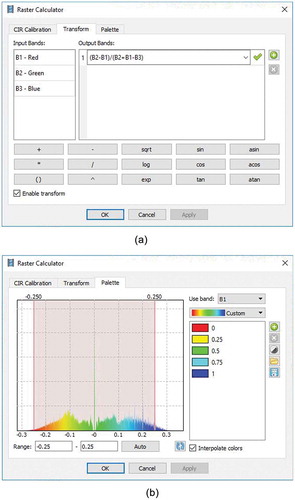
Figure 3. (a) The RGB point cloud of a small stand of trees from within the study site; (b) shows the corresponding normalised and Z clipped VARI-transformed point cloud
RGB, Red Green Blue; VARI, Visible Atmospheric Resistant Index
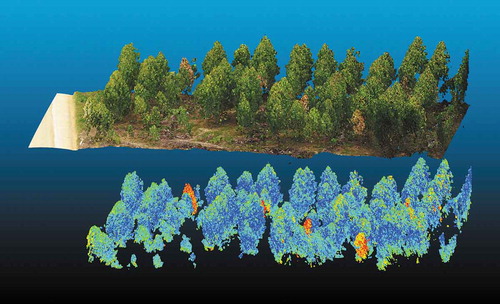
Figure 4. Comparison of a partially diseased Eucalyptus pellita crown as presented in the RGB point cloud dataset with the enhanced point cloud dataset transformed through application of the VARI algorithm to the individual points
RGB, Red Green Blue; VARI, Visible Atmospheric Resistant Index
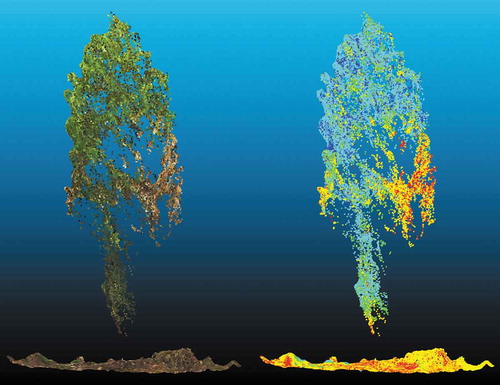
Figure 5. Nadir view of the VARI point cloud that has been height normalised and ‘Z clipped’ to remove the influence of the understorey and soil influences. The red dots represent necrotic trees
VARI, Visible Atmospheric Resistant Index
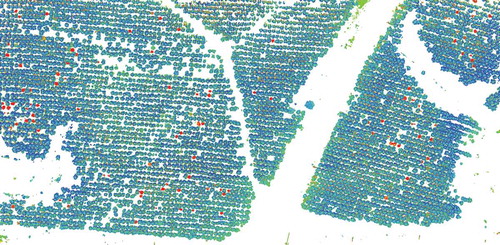
Table 2. Confusion matrix and accuracy results for visually detecting healthy, partially affected, dead and missing Eucalyptus pellita crowns affected by the bacterial wilt Ralstonia sp