Figures & data
Figure 1. Location of the three silvicultural trials of Eucalyptus nitens (Gads, Florentine and Urana) in Tasmania, Australia. The map of Tasmania is based on the ESRI Physical map of the Quick Map Services in QGis, which uses dark greens for dense forests, lighter greens for grasslands or agricultural areas, yellows and browns for arid land and deserts, and blues for water bodies. The island state of Tasmania is shown in a black rectangle in the bottom right insert of Australia
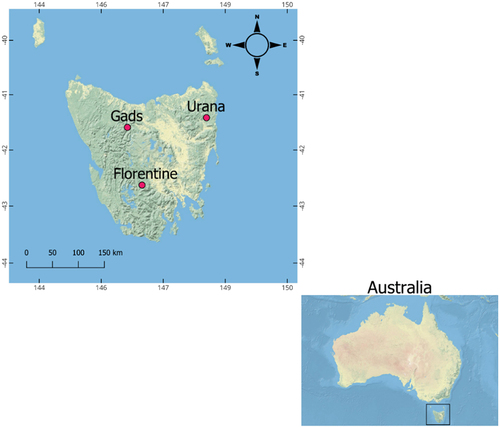
Table 1. General information on the three silvicultural trials of Eucalyptus nitens in Tasmania, Australia. Location, elevation, mean annual precipitation and temperature and plantation age at sampling and thinning. Overall grand means for outerwood basic density (standard deviations in parentheses) and diameter at breast height (DBH; standard deviations in parentheses) at sampling age for each site are also shown
Figure 2. Diagram of sample collection and processing. Disc wedges were collected at 2.5 m for radial assessment, outerwood cores and microdrill resistance (Resi) profiles from 144 Eucalyptus nitens trees in three silvicultural trials in Tasmania. The four 5 cm wood cores were taken at 1.3 m from the ground. To study longitudinal variation in checking, a single wedge was also taken in the field every 2.5 m, sampling from near ground level to 20 m up the stem. Wedge A (the most northerly) was normally selected for further processing
NIR = near-infrared
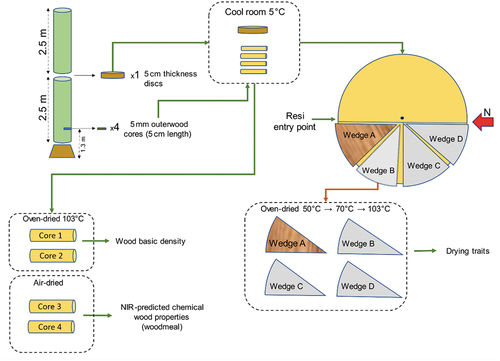
Table 2. Predictors used in Random Forest models (M1–M5) for predicting checking in wedges from discs taken from Eucalyptus nitens at 2.5 m above ground level (i.e. top of the first extracted log). Predictor names, units and description are shown
Figure 3. Variable importance for check area (a) and higher-order interaction strength (b) estimated from the Random Forest analysis of longitudinal data from 144 Eucalyptus nitens trees. The segmented vertical dashed line (reference accuracy) represents the root mean square error (RMSE) of the full model using the original data (unshuffled). The higher the value from the dash line, the more important the term. The bars show the 95% confidence interval after 1000 permutations; when the lower interval does not overlap the reference accuracy, the model term was considered important. Higher-order interactions were calculated based on Friedman’s H statistic of 100 model runs. Main effects are wedge height and site, tree social status, and treatment (thinned/unthinned). The composite terms are the two-, three- and four-way interactions between these main effects
Figure 4. Accumulated local effect (ALE) plots showing the predicted effect of stem height on check score for each combination of trial, treatment and social class. ALE plots display how changes in a specific stem height shift the model predictions towards higher or lower checking (based on check score). For example, wedges with scores higher than two units above the grand mean are predicted to occur at the bottom of the tree stem. 95% confidence intervals of the means around the thinned and unthinned treatment responses are shown with shading
Figure 5. Variable importance for the check area proportion in wedges taken at 2.5 m from 144 Eucalyptus nitens trees. The variable importance is based on the root mean square error (RMSE) loss. The segmented vertical dashed line represents the RMSE of the full model using the original data (unshuffled). The higher the value from the ‘reference accuracy’, the more important the term. The bars show the 95% confidence interval after 1000 permutations, and when the lower interval does not overlap the ‘reference accuracy’, the model term was considered important. The explained variance of the extended Forest model is R2 6.8%
Figure 6. Accumulated local effect (ALE) plots showing the predicted effect of silvicultural treatment by social status across the three sites on check area proportion. Analysis was undertaken using 1000 runs and 95% confidence intervals shown (bars). ALE plots display changes in check area proportion from the overall mean prediction (centred on zero); for example, suppressed thinned trees had lower check area proportion and these values are below the mean prediction
Figure 7. Variable importance for ring-level check area proportion (a) and higher-order interaction strength (b) of 144 Eucalyptus nitens studied trees. The segmented vertical dashed line represents the root mean square error (RMSE) loss from the full model using the original data and the bars show the 95% confidence interval after 1000 permutations. Higher-order interaction strength was calculated based on Friedman’s H statistic of 100 model runs. The main factors modelled were site, treatment (thinned/unthinned), ring position and social status
Figure 8. Accumulated local effect (ALE) plots showing the predicted effect of ring position on check area proportion within each Eucalyptus nitens tree ring. Analysis was undertaken using 1000 runs and 95% confidence intervals shown (shaded area). ALE plots display how changes in a specific ring position shift model predictions towards higher or lower check area proportion (overall mean centred to zero). The vertical dash lines indicate the rings of peak checking in the unthinned and thinned treatments. Trials were thinned at 8–9 years of age and radial variation in checking was recorded 2.5 m up the stem. Age at thinning corresponds to the ring positions 5, 6 and 7 at Urana, Florentine and Gads, respectively
Figure 9. Spatial representation of check distribution on wood discs (sampled at 2.5 m) from wedge-derived radial prediction of checking. Predictions at ring level were obtained from Random Forest models. Dark blue regions represent areas with a higher proportion of checks. Ring widths were calculated based on the average ring width at the wedge level for each site, social status and treatment combination shown. The thinning treatment slightly shifts check concentrations towards the stem periphery, with the extent of the shift depending on site and social status
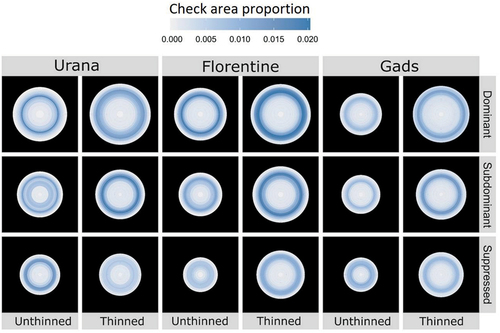
Figure 10. Variable importance for check area proportion at the wedge level for 144 Eucalyptus nitens trees based on the model M5 (all traits included; see details in ). The segmented vertical line represents the RMSE loss of the full model using the original data and the bars show the 95% confidence interval after 1000 permutations
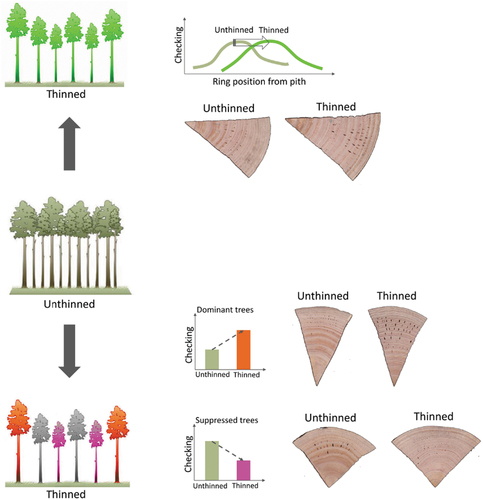
Figure 11. Schematic diagram of the two main findings of the present study. The general trend at the ring level depicts the delay in checking in trees from thinned stands (top panel). The bar plots (bottom panel) depict the main tree-level differences between dominant and suppressed cohorts in the unthinned and thinned treatments. The wedges represent examples of each situation
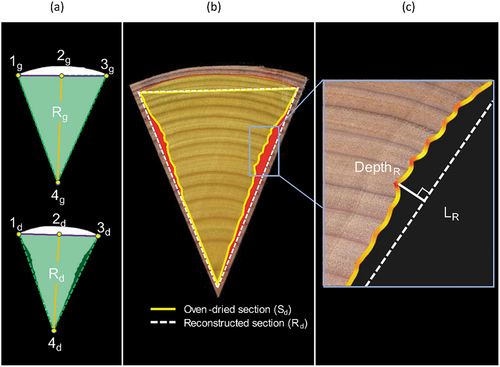
Appendix Figure A1. Image segmentation for a green (a, top) and its corresponding oven-dried wedge (a, bottom). The overlapped images (b) and the collapse area (in red) are also shown. The absolute local curvature along the radial face of an oven-dried wedge and an expanded area of the right-side contour is shown (c). The maximum depth of collapse (DepthR) along the reconstructed straight edges of a wedge is also depicted in (c). The coding is explained in the text. Figure modified from Rocha-Sepulveda et al. (2021)
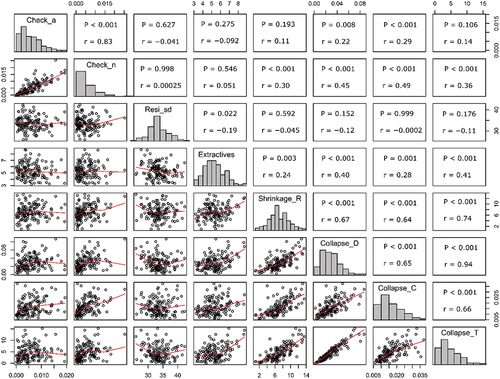
Appendix Figure B1. Correlation matrix showing check area proportion and number of checks in wedges taken at 2.5 m (tree-level analysis; n 144) and their correlation with the most important variables in the Random Forest model (M5; Figure 11). Correlations significantly different from zero are indicated: *0.01 ≤ P < 0.05; **0.001 ≤ P < 0.01; ***P < 0.001. Check_a: check area proportion; Collapse_C: collapse curvature; Collapse_D: depth of collapse (%); Check_n: check number proportion; Collapse_T: collapse total area (%); Extractives: Near-infrared (NIR)-predicted extractives content (%); Resi_sd: standard deviation of microdrill resistance-derived wood density (ring position 4–9); Shrinkage_R: radial shrinkage (%)
Appendix Figure C1. Accumulated local effect (ALE) plots showing the predicted effect of ring position on ring width within each Eucalyptus nitens tree ring. Analysis was undertaken using 1000 runs, and 95% confidence intervals are shown (shaded area). ALE plots display how changes in a specific ring position shift model predictions toward higher or lower check area proportion (overall mean centred to zero). Trials were thinned at 8–9 years of age and ring data were recorded 2.5 m up the stem. Age at thinning correspond to the ring positions 5, 6 and 7 at Urana, Florentine and Gads, respectively
Appendix Figure D1. Accumulated local effect (ALE) plots showing the predicted effect of Collapse_C, Collapse_D, Resi_sd, Resi_rate, Extractives and Shrinkage_R on check area proportion. Analysis was undertaken using 1000 runs and 95% confidence intervals are shown (shaded area). Rug plots along the bottom indicate the distribution of the data (individual trees)