
Figures & data
Figure 1. Total monthly overseas arrivals and short-term visitor arrivals, Australia Jan 2018 to Jan 2022. Source: Australian Bureau of Statistics, Overseas Arrivals and Departures, Australia December 2022.
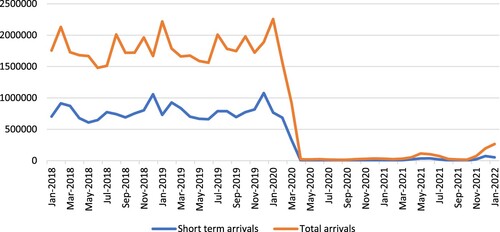
Figure 2. Quarterly net internal migration greater capital cities combined, Australia Q1 2016 to Q1 2021. Source: Australian Bureau of Statistics, Regional internal migration estimates, provisional March 2021.
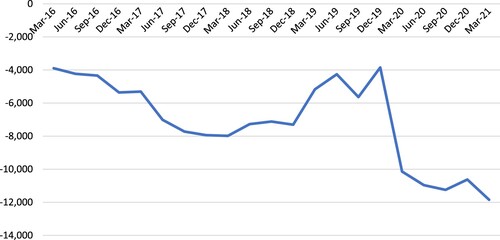
Table 1. 6-month study periods with respect to important COVID lockdown/reopening dates.
Figure 3. Quarterly Rental Price for GSyd and RNSW. Source: APM rental data.
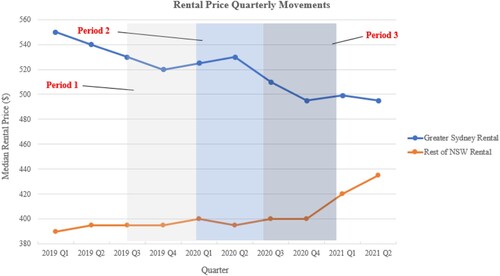
Figure 4. Rental price % change between periods, Q4 2019 to Q1 2021. (a) Greater Sydney: SA3 Areas; (b) Rest of NSW: SA3 Areas. Source: APM rental data.
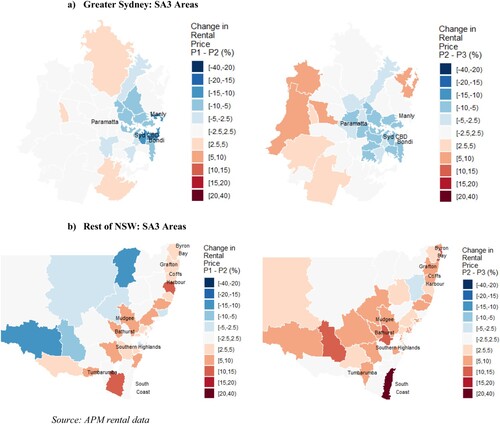
Figure 5. Changes in Airbnb activity, Greater Sydney and Rest of NSW Q1 2019 to Q2 2021 (N = 73,937 total Airbnb listings). Source: AirDNA Airbnb data.
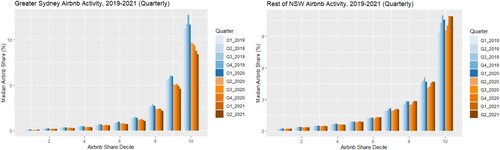
Figure 6. Rental supply changes by share of Airbnb lettings (deciles), Greater Sydney and Rest of NSW Q4 2019 to Q1 2021 (N = 73,937 total Airbnb listings). Source: APM rental data, AirDNA Airbnb data.
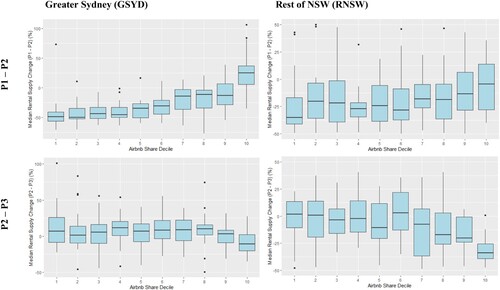
Figure 7. Airbnb share of rental market (left hand) and vacancy rates for LTR’s (right hand) for selected metropolitan and urban vacancy rate areas. (a) Greater Sydney; (b) Rest of NSW (selected hotspots). Source: REINSW, AirDNA Airbnb data
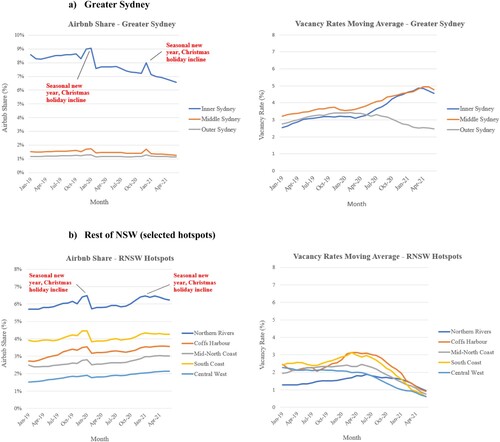
Figure 8. Long-term rental prices changes by share of Airbnb lettings (deciles), Greater Sydney and Rest of NSW Q4 2019 to Q1 2021 (N = 73,937 total Airbnb listings). Source: AirDNA Airbnb data
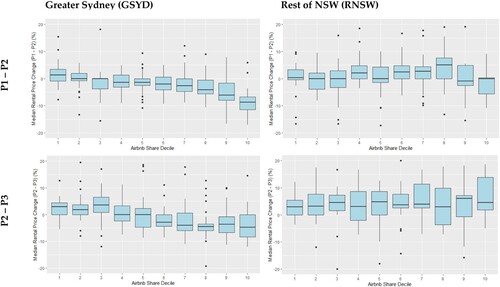
Figure 9. Comparison of changes in Airbnb listings against changes in LTR rental prices, January 2019 to April 2020.
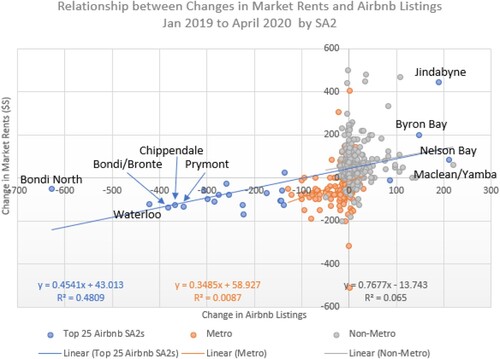
Figure 10. Rental price and vacancy rate quarterly movements in case study areas. (a) Eastern Suburbs North. Source: NSW Rental Bond data; (b) Byron Bay. Source: NSW Rental Bond data.
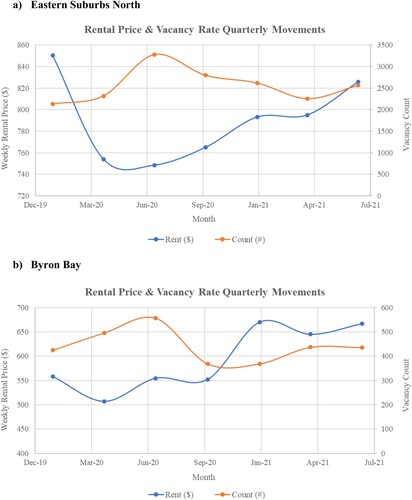
Table 2. Airbnb activity and rental price movements in case study area.
Table 3. Summary of rental yield and investor activity in selected higher-value GSyd and RNSW areas