Figures & data
Figure 1. Simulated flight task.
Figure 2. Attention allocation test.
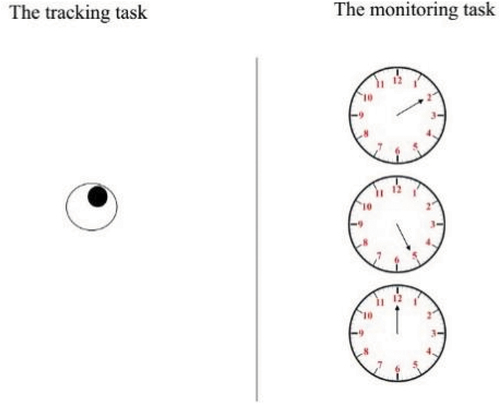
Figure 3. Attention shift test.
Figure 4. Spatial orientation test.
Figure 5. The completion time of take-off and cruise tasks between VGPs and NVGPs.
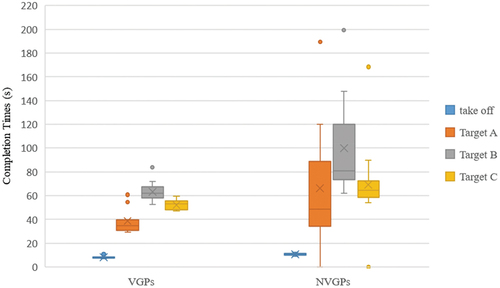
Table 1. Descriptive statistics for the t-test for differences in eye movement during the flight between VGPs and NVGPs (M(SD))
Figure 6. (a) Fixation count in different area of interest (Take-off). (b) Fixation time in different area of interest (Take-off).
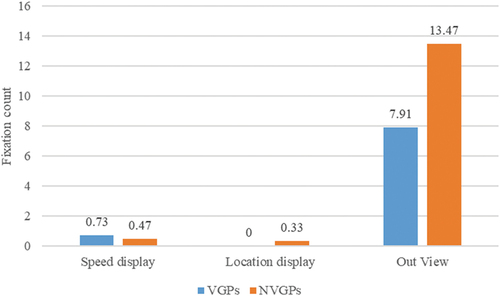
Figure 6. Continued.
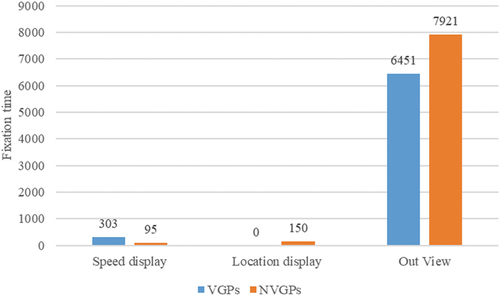
Figure 7. (a) Fixation count in different area of interest (Cruise). (b) Fixation time in different area of interest (Cruise).
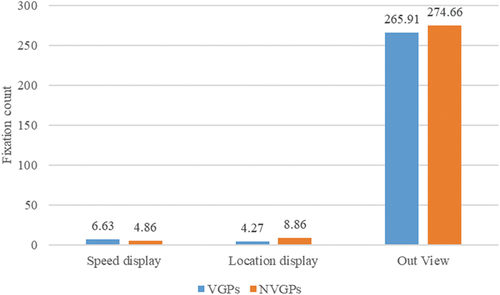
Figure 7. Continued.
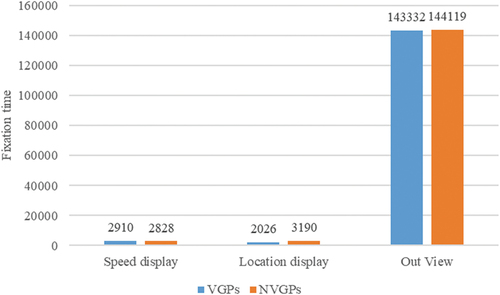
Table 2. Descriptive statistics for the Mann-Whitney U test for differences in entropy between VGPs and NVGPs
Table 3. Descriptive statistics for the spatial orientation and attention skills test between VGPs and NVGPs
Table 4. The influence of attention shift and group on flight performance
Figure 8. Mediation model diagram.
Table 5. The fitting index of neural network model
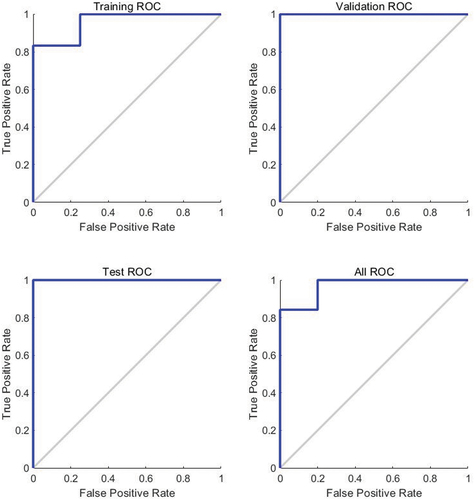
Figure 9. (a) Confusion matrixes. (b) ROC curves.
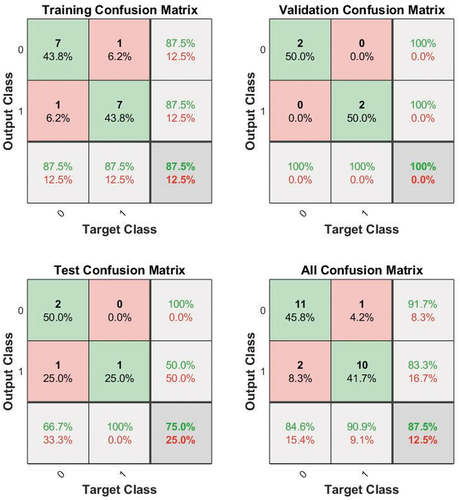
Figure 9. Continued.
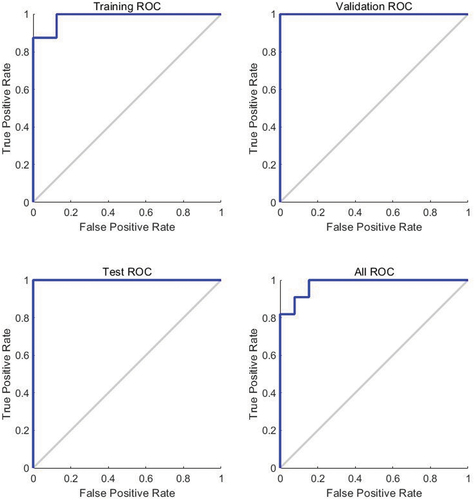
Table 6. The fitting index of neural network model
Figure 10. ROC curves.
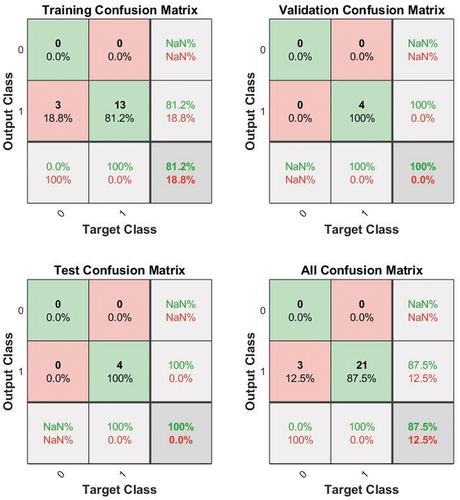
Figure 10. Continued.
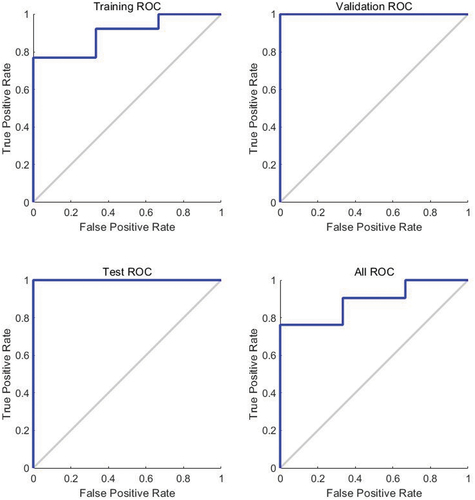
Table 7. The fitting index of neural network model
Figure 11. (a) Confusion matrixes. (b) ROC curves.
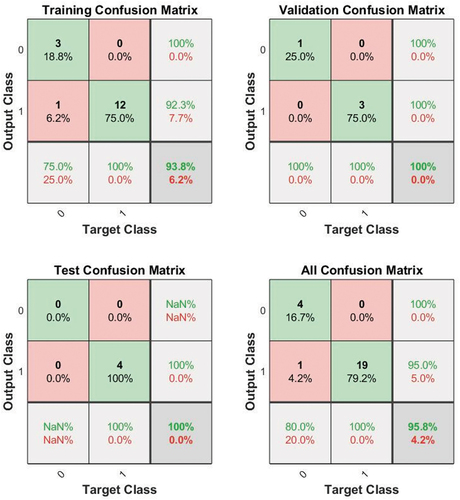
Figure 11. Continued.