Figures & data
Table I. Psychometric data
Table II. Zero-order correlations among variables of interest
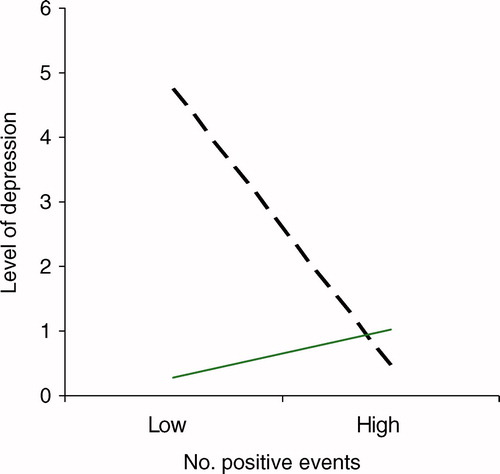
Figure 1. Predicted depressive symptoms as a function of life events and level of attributional style for positive events. (– –) Low positive attributional style; (––) high positive attributional style.
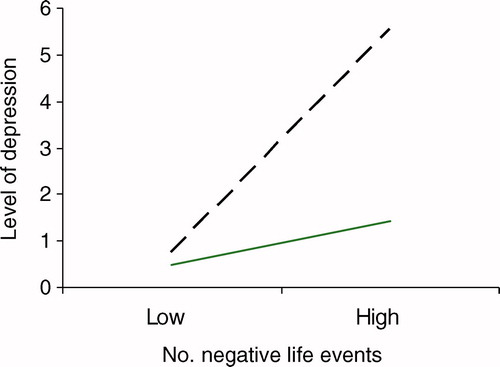
Table III. Prediction of depressive symptoms in children at T2: no. negative life events and level of positive attributional style for positive events
Figure 2. Predicted depressive symptoms in children as a function of frequency of negative events and frequency of positive events. (– –) Low no. positive events; (––) high no. positive events.
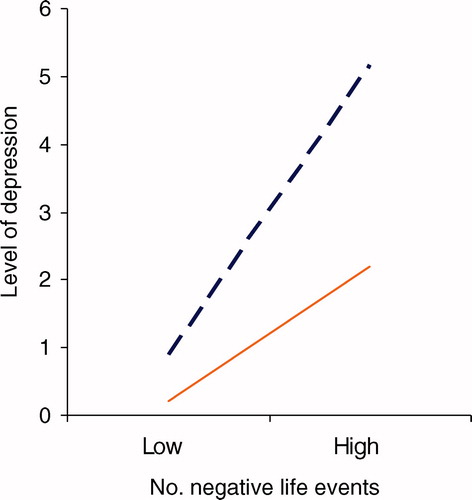
Table IV. Prediction of depressive symptoms in children at T2: no. negative and positive life events
Figure 3. Predicted depressive symptoms as a function of frequency of positive events and level of positive attributional style for positive events. (– –) Low positive attributional style; (––) high positive attributional style.